

Measure Employee Advocacy by treating employee posts like a measurable media channel – with clear goals, consistent tracking, and decision rules you can repeat every month. When you do it well, you can answer three questions executives actually care about: did employees participate, did their content reach the right people, and did it drive business outcomes. This guide shows a practical framework, the metrics that matter, and simple formulas you can use in a spreadsheet. It also defines the marketing terms that often get mixed up in advocacy programs, especially when employee content overlaps with influencer and paid social tactics. Finally, you will get templates, tables, and a reporting cadence that keeps the program credible and improving.
Measure Employee Advocacy goals first – then pick KPIs
Before you build dashboards, decide what success means for your company in plain language. Employee advocacy can support brand awareness, recruiting, thought leadership, pipeline, customer retention, or product launches, but one program cannot optimize for everything at once. Start by choosing one primary goal and one secondary goal for the next 90 days. Then map each goal to a small set of KPIs you can actually influence through enablement, content, and coaching. As a rule, if a metric cannot change based on an action you can take next week, it is not a good KPI for your core report.
Use this decision rule: pick 1 outcome metric, 2 to 3 leading indicators, and 1 quality check. For example, if your outcome is qualified leads, your leading indicators might be link clicks and landing page conversion rate, while your quality check could be audience relevance or comment quality. This keeps the program from drifting into vanity metrics. If you need ideas for how measurement frameworks are applied across creator and influencer programs, the InfluencerDB blog on measurement and campaign planning is a useful reference point for structuring KPIs and reporting narratives.
| Program goal | Outcome KPI | Leading indicators | Quality check | What to do if it is low |
|---|---|---|---|---|
| Brand awareness | Reach (unique) | Impressions, posting frequency | Audience fit, share rate | Refresh content angles, add visuals, coach hooks |
| Employer brand | Career page visits | Link clicks, CTR | Time on page, bounce rate | Update landing page, add role specific CTAs |
| Demand generation | MQLs or demo requests | Clicks, conversion rate | Lead quality, sales acceptance | Improve targeting, tighten offer, test copy |
| Thought leadership | Share of voice (topic) | Engagement rate, saves | Comment sentiment, expert mentions | Shift to stronger POV posts, add data and examples |
Key terms you need to measure advocacy correctly
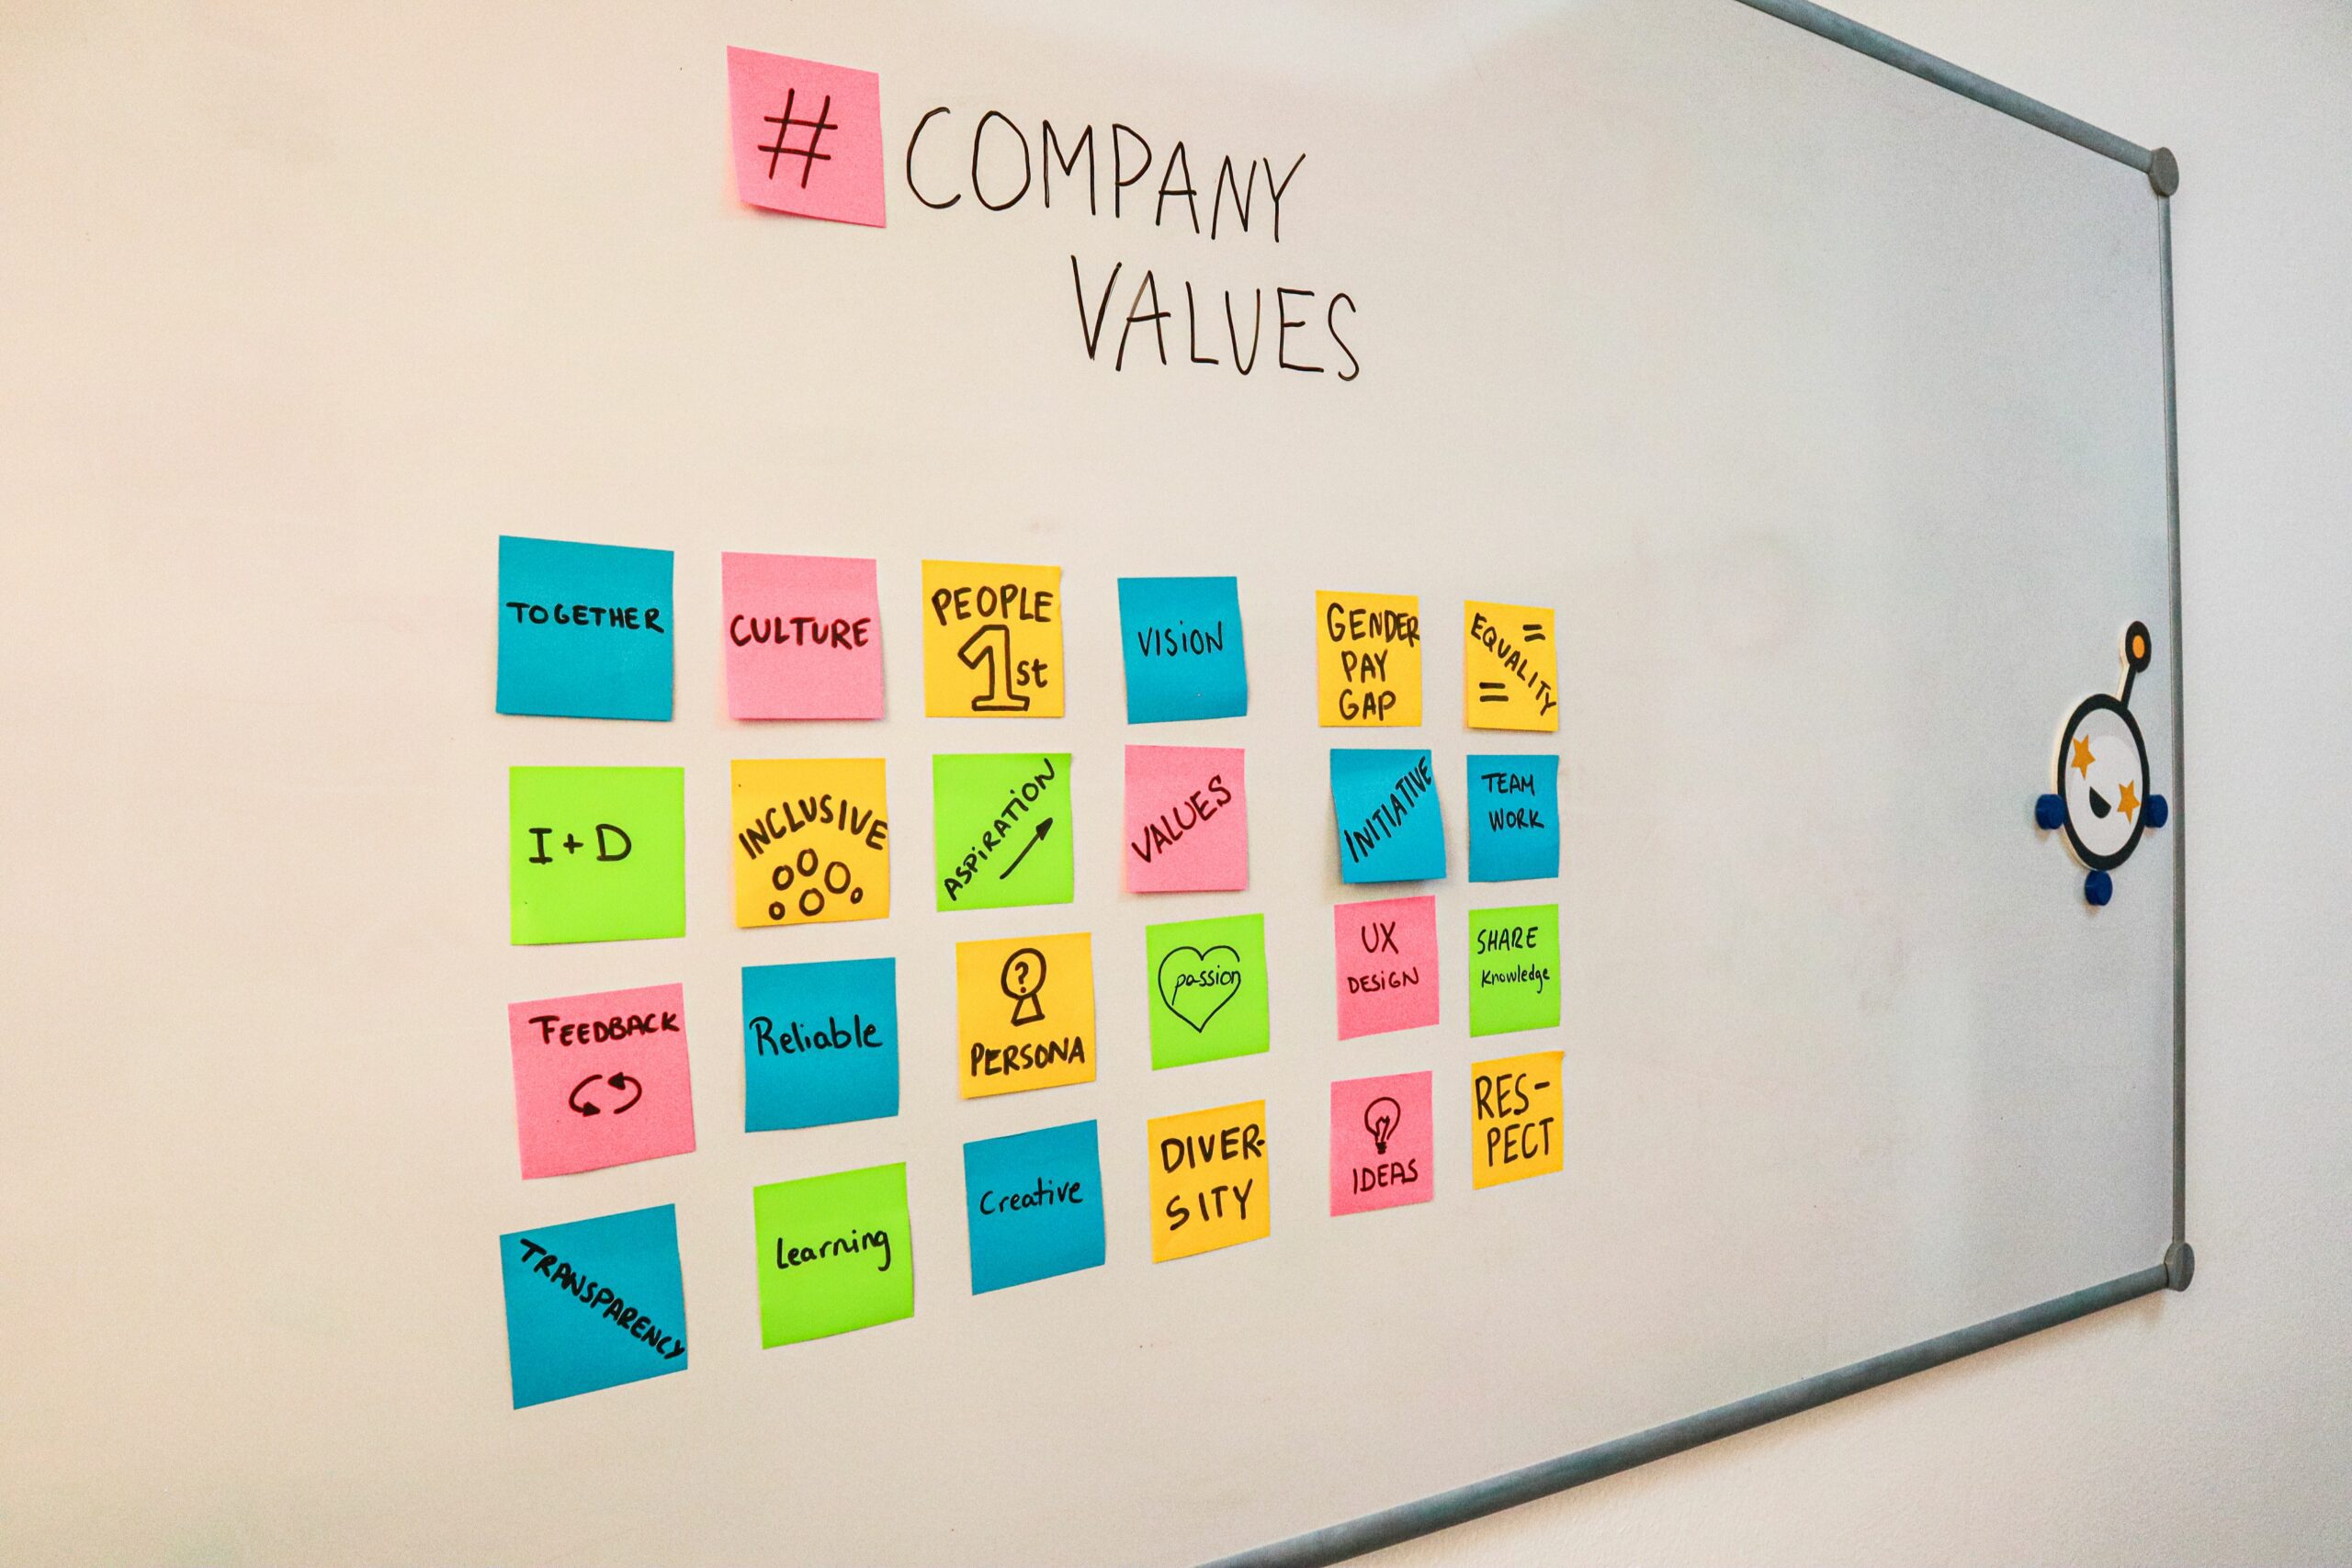
Employee advocacy reporting gets messy when teams use different definitions. Align on a shared glossary before you publish your first monthly report. That way, a recruiter, a brand marketer, and a sales leader will interpret the same chart the same way. Keep the definitions simple and operational, meaning each term should tell you exactly what to measure and where it comes from.
- Reach – the number of unique people who saw a post.
- Impressions – total views, including repeat views by the same person.
- Engagement rate – engagements divided by impressions (or reach) times 100. Choose one denominator and stick with it.
- CPM – cost per thousand impressions. Formula: (cost / impressions) x 1000.
- CPV – cost per view, typically for video. Formula: cost / views.
- CPA – cost per acquisition or action (lead, signup, purchase). Formula: cost / acquisitions.
- Whitelisting – when a brand runs paid ads through an individual’s social account (common in influencer marketing). In employee advocacy, this is less common but can be used for executive thought leadership with consent.
- Usage rights – permission to reuse someone’s content in other channels (website, ads, email). Get it in writing.
- Exclusivity – restrictions that prevent a person from promoting competitors for a period. For employees, this is usually covered by employment agreements, but clarify boundaries for public posting.
Concrete takeaway: write these definitions into your advocacy program one pager and paste them into every dashboard description. Consistency is what makes trends believable.
Instrumentation: tracking links, UTMs, and clean data
Most advocacy programs fail measurement because tracking is optional or inconsistent. Fix that by making tracking the default, not a special request. Create a simple link library with prebuilt UTMs for each campaign, landing page, and employee cohort. Then give employees a one tap way to copy the right link, whether you use an advocacy platform or a shared document. If you only do one thing this quarter, do this, because it turns “nice engagement” into attributable traffic and conversions.
Use a UTM structure that answers who, what, and why. A practical pattern is: utm_source=linkedin (or x, instagram), utm_medium=employee_advocacy, utm_campaign=product_launch_q4, utm_content=post_template_3, and optionally utm_term=topic_keyword. Keep naming conventions lowercase and consistent to avoid duplicate rows in analytics. Google’s own guidance on building UTMs is a solid reference if you need a standard to point to internally: Google Analytics Campaign URL Builder guidance.
Concrete takeaway checklist for clean tracking:
- Lock a naming convention and publish it in the link library.
- Prebuild links for employees so they are not typing UTMs manually.
- Use one landing page per offer when possible to simplify attribution.
- Audit analytics weekly for broken UTMs and fix fast.
Core metrics dashboard: participation, content performance, business impact
A useful advocacy dashboard has three layers. First, participation tells you whether the program is alive: how many employees posted, how often, and from which teams. Second, content performance tells you whether the posts earned attention: reach, impressions, engagement rate, and click through rate. Third, business impact tells you whether attention turned into outcomes: leads, applicants, signups, meetings, or revenue influenced. When you separate these layers, you can diagnose problems quickly instead of arguing about whether the program “worked.”
For participation, track active advocates (posted at least once in the period), posts per advocate, and activation rate (active advocates divided by invited employees). For performance, track median reach per post, engagement rate, and click through rate for tracked links. Use medians, not just averages, because a few executives can skew the mean. For impact, track conversions from UTM traffic, assisted conversions, and pipeline influenced if your CRM supports it.
| Metric | Formula | Good for | Watch out for | Action lever |
|---|---|---|---|---|
| Activation rate | Active advocates / Invited employees | Program adoption | Invited list includes inactive staff | Onboarding, manager nudges |
| Engagement rate | Engagements / Impressions | Content resonance | Different platforms define engagements differently | Better hooks, POV, visuals |
| CTR | Link clicks / Impressions | Offer strength | Click data may be incomplete without tracking links | Stronger CTA, clearer landing page |
| Conversion rate | Conversions / Sessions | Landing page effectiveness | Mixed intent traffic can lower rate | Message match, page speed, form length |
| Earned media value proxy | (Impressions / 1000) x Paid CPM benchmark | Executive friendly context | Not the same as true ROI | Increase reach, improve content quality |
How to calculate ROI for employee advocacy (with examples)
ROI debates usually stall because teams mix costs and outcomes. Start by listing real costs: employee time, program management time, creative support, advocacy platform fees, and any paid amplification. Then choose one outcome you can credibly attribute, such as leads, applicants, or event registrations. If revenue attribution is immature, report ROI in stages: traffic and conversions now, pipeline influence later. This staged approach builds trust because you are not overclaiming.
Step 1: Calculate program cost. Example: 40 employees spend 30 minutes per week posting and responding. That is 20 hours per week. If you use a blended hourly cost of $60, monthly employee time cost is 20 x 4 x 60 = $4,800. Add program manager time (10 hours per month at $70 = $700) and tools ($500). Total monthly cost = $6,000.
Step 2: Calculate attributable outcomes. Example: UTMs show 2,400 sessions from employee posts in a month. The landing page converts at 2.5 percent to leads, so leads = 2,400 x 0.025 = 60. If historical lead to customer rate is 10 percent and average gross profit per customer is $2,000, expected gross profit = 60 x 0.10 x 2,000 = $12,000.
Step 3: ROI formula. ROI = (Return – Cost) / Cost. Using the example: (12,000 – 6,000) / 6,000 = 1.0, or 100 percent ROI. If you are not comfortable projecting revenue, report CPA instead: CPA = cost / leads = 6,000 / 60 = $100 per lead. Concrete takeaway: pick the metric your finance team already uses for other channels, then report advocacy in the same language.
Benchmarking and targets: what “good” looks like in practice
Benchmarks for employee advocacy vary by platform, industry, and employee seniority. Still, you can set practical targets by using your own baseline plus a small improvement goal each quarter. Start with a 30 day baseline where you measure participation and performance without heavy pressure. Then set targets like “increase activation rate from 12 percent to 18 percent” or “raise median engagement rate by 20 percent” rather than chasing arbitrary external numbers.
To add context, compare your advocacy CPM proxy to what you pay for paid social. If your paid LinkedIn CPM is $35 and your advocacy earned media proxy is $12, you can argue the channel is efficient even before revenue attribution is perfect. For broader context on how social metrics are defined and why they change, Meta’s documentation is a reliable place to sanity check terms and reporting differences: Meta Business Help Center.
Concrete takeaway: set targets in three tiers – minimum (keep the program alive), expected (steady growth), and stretch (requires new tactics like executive participation or content series). This avoids demoralizing teams when a stretch goal is missed.
Operating rhythm: weekly actions and a monthly report leaders will read
Measurement only matters if it changes behavior. Build a weekly cadence that focuses on inputs you can control, then a monthly cadence that tells a clear story. Weekly, review participation, top posts, and link performance, then adjust the content queue. Monthly, summarize progress against goals, highlight what worked, and name the next experiments. Keep the report short, but make the appendix detailed so analysts can dig in.
Here is a practical monthly report outline you can copy:
- Headline results – activation rate, total reach, total clicks, conversions.
- What drove results – top 5 posts with notes on why they worked.
- Audience insights – which job titles or regions engaged most.
- Business impact – leads, applicants, meetings, or pipeline influenced.
- Next month plan – 2 experiments and 1 operational fix.
Concrete takeaway: include one chart that connects employee activity to outcomes, such as “posts with tracked links produced X percent of total conversions.” It keeps the program from being judged on likes alone.
Common mistakes when you measure employee advocacy
- Counting posts, not outcomes – volume can rise while impact falls if content becomes repetitive.
- No tracking links – without UTMs, you cannot connect advocacy to traffic or conversions.
- Using averages only – a few high reach accounts can hide that most employees get little distribution.
- Comparing platforms directly – engagement behaviors differ, so normalize within each platform.
- Overclaiming ROI – if attribution is weak, report CPA and leading indicators first.
Concrete takeaway: run a monthly data quality audit. Check for missing UTMs, inconsistent campaign names, and sudden metric spikes that suggest reporting changes rather than real performance.
Best practices: make advocacy measurable and sustainable
Strong advocacy programs respect employee autonomy while still producing consistent data. Give employees content prompts, not scripts, and track performance by template type so you learn what works. Train a small cohort of champions first, then expand once you have proof and a repeatable process. Also, keep compliance simple: remind employees to be truthful, avoid confidential information, and disclose relationships when required. If you need a clear standard for endorsements and disclosures, the FTC’s guidance is the authoritative reference: FTC endorsements and testimonials guidance.
Best practice checklist you can implement this week:
- Create 3 post templates per month: a POV post, a customer story, and a behind the scenes post.
- Attach one tracked link option to each template, even if the post can be link free.
- Report medians and percentiles, not just totals.
- Tag content themes so you can compare performance by topic.
- Hold a 20 minute monthly retro with advocates to learn what is hard and fix it.
Concrete takeaway: treat employee advocacy like an editorial product. When you plan themes, measure consistently, and iterate, the numbers improve without burning people out.
Quick start: a 14 day measurement setup plan
If you want momentum, follow a two week setup that ends with a working dashboard and a baseline report. On days 1 to 2, lock goals, definitions, and your KPI list. On days 3 to 5, build the UTM naming convention and link library, then test it end to end in analytics. Next, on days 6 to 10, publish 6 to 10 post templates and recruit a pilot group of 15 to 25 employees across functions. Finally, on days 11 to 14, pull results, calculate baseline medians, and document what you learned.
Concrete takeaway: do not wait for perfect tooling. A spreadsheet plus consistent UTMs can produce credible results, and you can upgrade tools after you prove the channel.