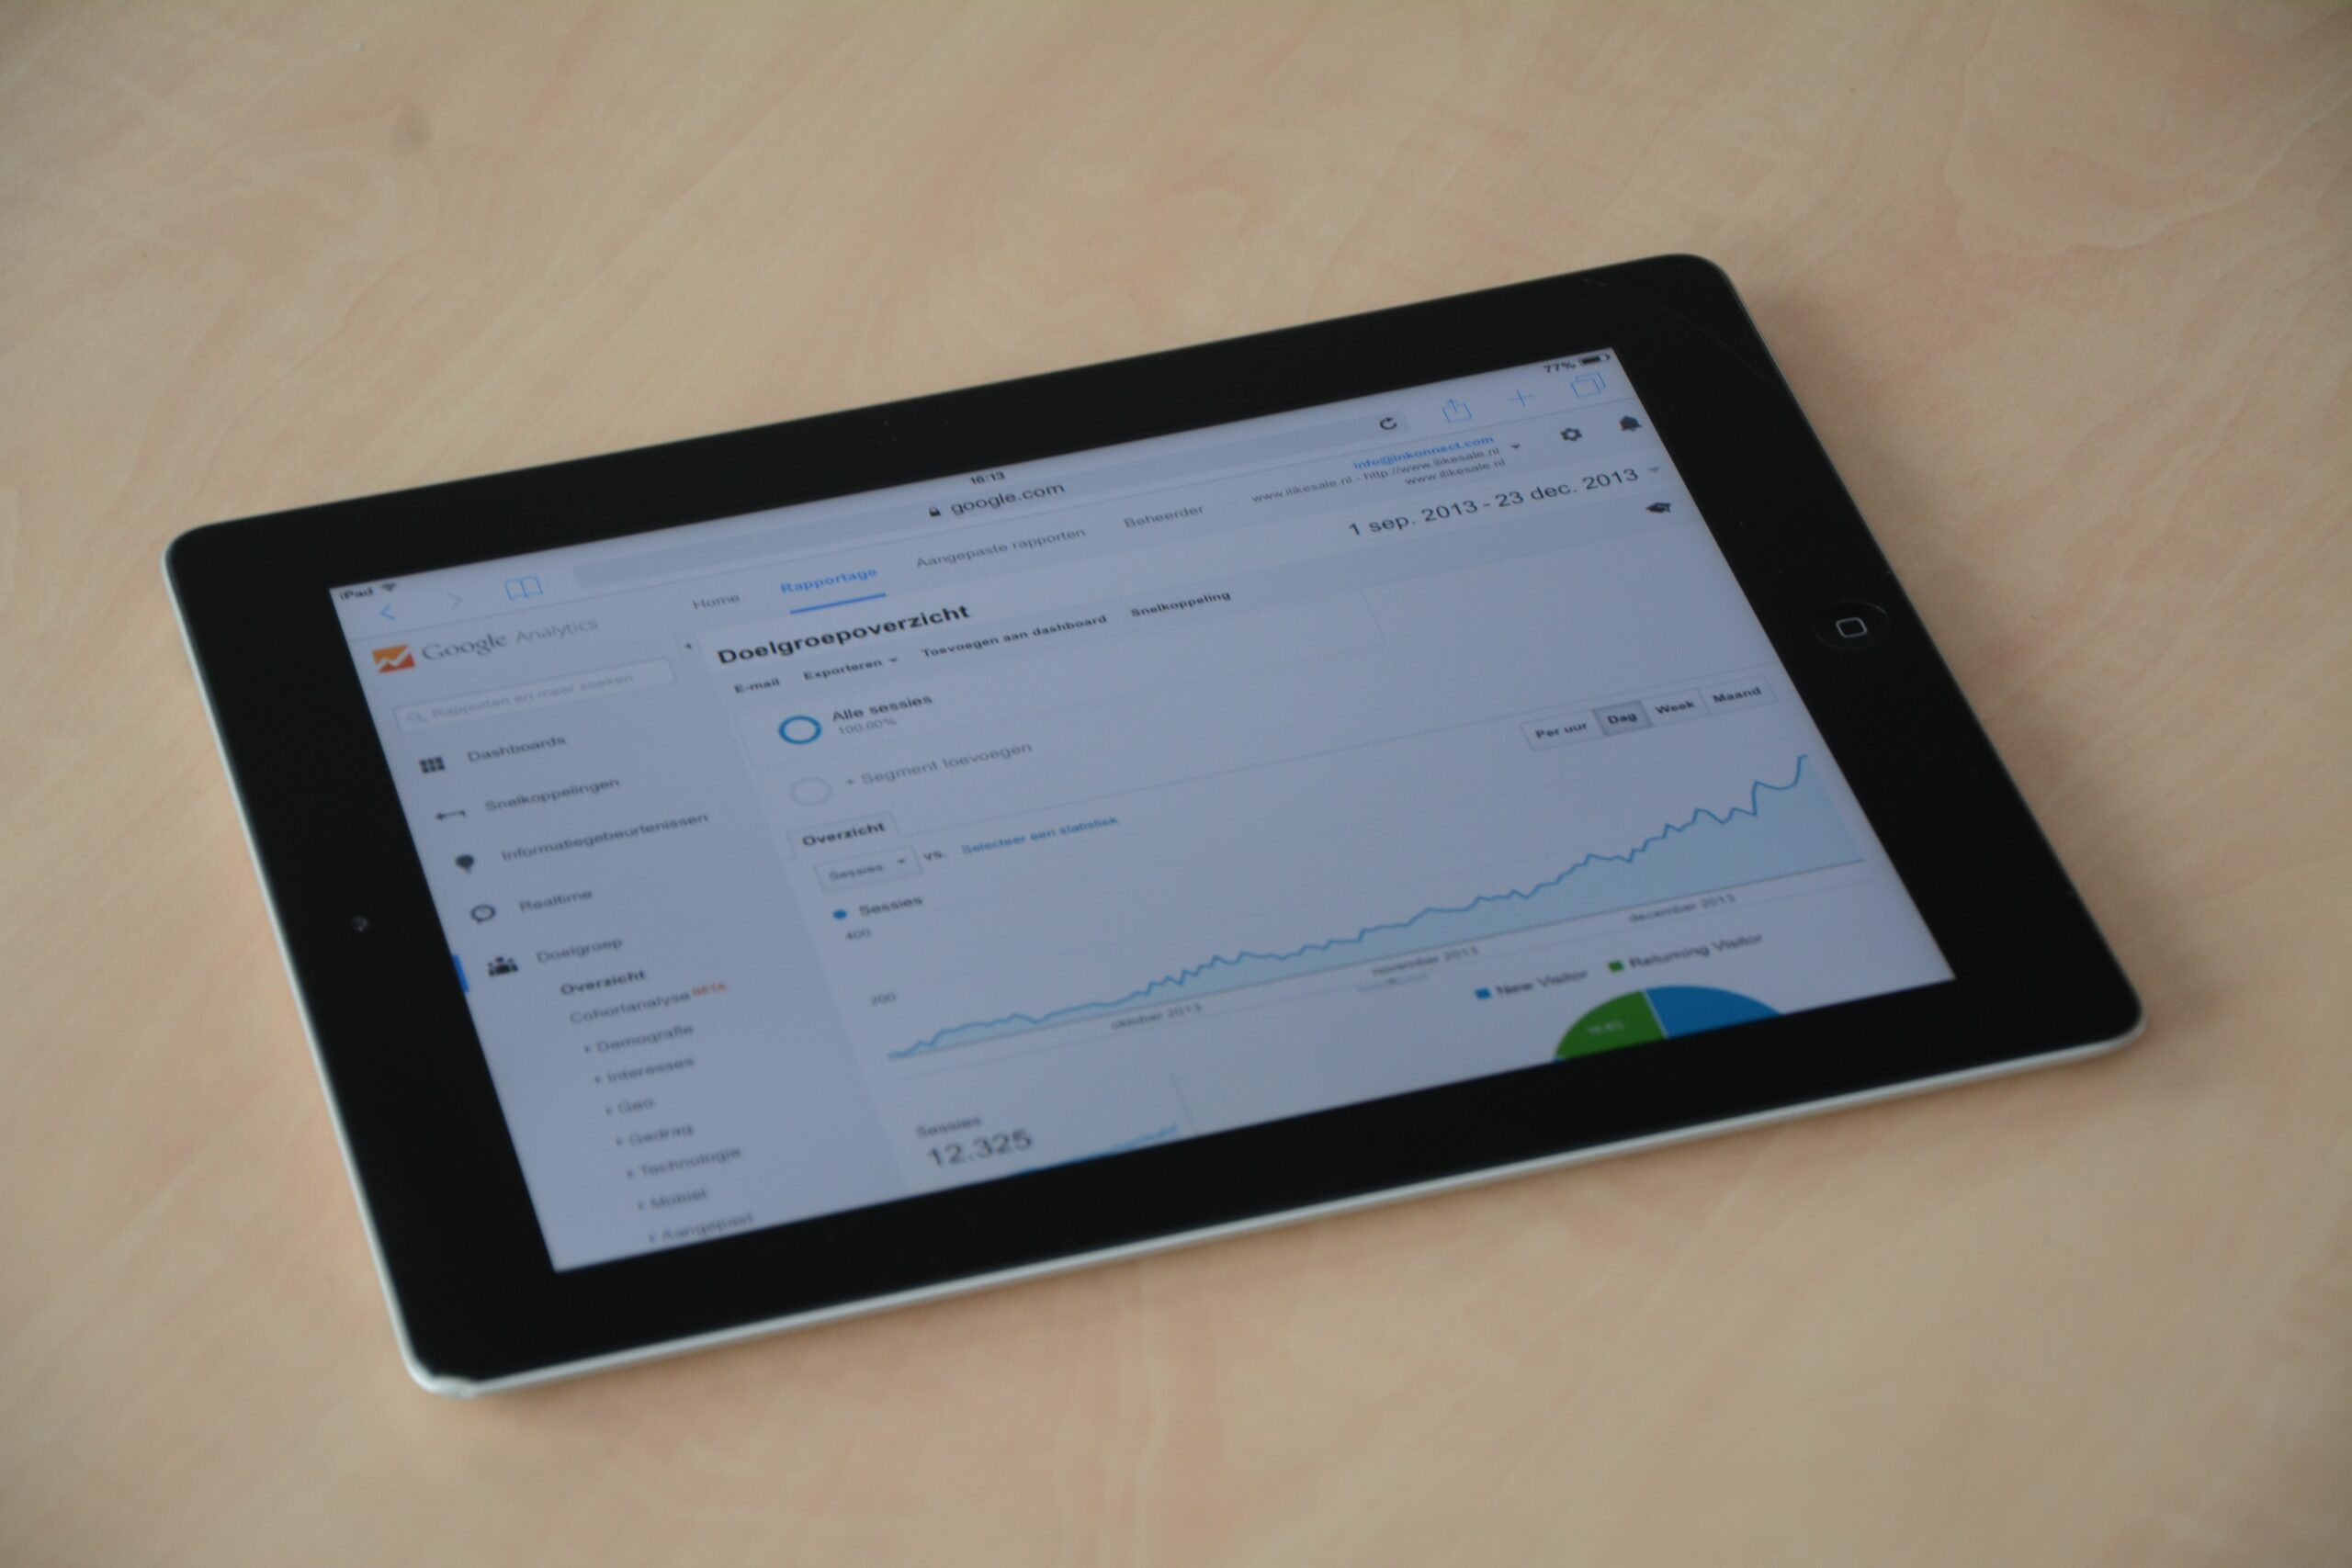

Post Performance Report is the fastest way to turn October 2024 content into clear decisions about what to repeat, what to cut, and what to test next. Instead of celebrating a single viral post or blaming the algorithm, this report format forces you to separate distribution (reach and impressions) from resonance (engagement and watch time) and from outcomes (clicks, signups, sales). In practice, that separation is what makes the numbers useful. You can have strong engagement on weak reach, or huge reach with poor conversion, and the fix is different in each case. This guide gives you a practical, repeatable reporting structure you can use for brand pages, creator accounts, or influencer campaigns.
Post Performance Report: the metrics that matter (and what they mean)
Before you build the report, align on definitions. Teams often talk past each other because the same word means different things across platforms and tools. Use the terms below as your shared glossary, then keep them consistent month to month. That consistency is what makes trends real, not just noise. Finally, write these definitions into your reporting doc so stakeholders stop asking for re-explanations in every meeting.
- Reach – unique accounts that saw the post at least once.
- Impressions – total views, including repeat views by the same person.
- Engagement – interactions such as likes, comments, shares, saves, and sometimes clicks (define what you include).
- Engagement rate (ER) – engagement divided by reach or impressions (pick one and stick with it).
- CPM (cost per mille) – cost per 1,000 impressions. Formula: CPM = (Spend / Impressions) x 1000.
- CPV (cost per view) – cost per video view. Formula: CPV = Spend / Views.
- CPA (cost per acquisition) – cost per desired action (signup, purchase). Formula: CPA = Spend / Conversions.
- Video completion rate – percent of viewers who watched to the end (or to a defined milestone like 50 percent).
- Whitelisting – running ads through a creator’s handle (also called creator licensing in some tools).
- Usage rights – permission to reuse creator content in your channels or ads, with scope and duration.
- Exclusivity – creator agrees not to work with competitors for a defined time and category.
Concrete takeaway: choose one engagement rate definition for October and keep it for November. If you change the denominator midstream, you will misread performance and overcorrect.
How to build an October 2024 report in 7 steps (template you can reuse)

A good monthly report is not a data dump. It is a decision document with a consistent structure. Use the steps below to produce a report that can be read in five minutes but still holds up under scrutiny. If you manage influencer deliverables, you can apply the same steps per creator and then roll up totals for the campaign.
- Set the reporting window – for October 2024, decide whether you use calendar month posting date, or performance accrued during the month (important for evergreen posts).
- Lock your post list – include post URL, platform, format (Reel, TikTok, Short, carousel), and publish time.
- Pull raw metrics – reach, impressions, engagements, video views, watch time, profile visits, link clicks, and conversions if tracked.
- Normalize – calculate ER, saves per 1,000 reach, shares per 1,000 reach, CTR, and completion rate.
- Segment – split by format, hook type, topic, length, and creator (if applicable).
- Explain outliers – annotate the top 10 percent and bottom 10 percent posts with a short hypothesis.
- Turn insights into actions – 3 things to repeat, 3 things to stop, 3 tests for next month.
Concrete takeaway: if you cannot name the next test after reading the report, the report is not finished.
October 2024 scorecard: a simple table that forces clarity
Start with a one-page scorecard so stakeholders see the story immediately. Then place deeper analysis below. The table format matters because it makes tradeoffs visible: reach can rise while conversions fall, and you need to see both at once. If you run influencer campaigns, add a column for creator handle and deliverable type.
| Metric | October 2024 | MoM change | Target | What it suggests |
|---|---|---|---|---|
| Total posts | __ | __ | __ | Volume and consistency |
| Reach | __ | __ | __ | Distribution strength |
| Impressions | __ | __ | __ | Frequency and replay |
| Engagement rate (by reach) | __% | __ | __% | Creative resonance |
| Shares per 1,000 reach | __ | __ | __ | Virality potential |
| Saves per 1,000 reach | __ | __ | __ | Utility and intent |
| Link CTR | __% | __ | __% | Offer and CTA clarity |
| Conversions | __ | __ | __ | Business impact |
| CPA | $__ | __ | $__ | Efficiency |
Concrete takeaway: pick one primary KPI for October (for example, conversions) and two supporting KPIs (for example, saves per 1,000 reach and CTR). That prevents the report from becoming a debate club.
Benchmarks and decision rules you can apply immediately
Benchmarks are only useful if they lead to decisions. Rather than chasing generic industry averages, create internal benchmarks by format and by content pillar. Still, you need a starting point for what “good” looks like. Use the rules below as a practical filter, then refine them with your own historical data.
| Signal | What to check | Decision rule | Next action |
|---|---|---|---|
| High reach, low ER | Hook, pacing, creative mismatch | ER below your median by 25%+ | Rewrite first 2 seconds, tighten edit, test new thumbnail or first frame |
| Low reach, high saves | Distribution issue, posting time, format | Saves per 1,000 reach in top quartile | Republish as carousel, add keywords, cross-post, consider boosting |
| High shares, low CTR | CTA placement, offer clarity | Shares strong but CTR below median | Move CTA earlier, simplify offer, add pinned comment with link context |
| Strong CTR, weak conversion | Landing page, message match | CTR up but conversion rate down | Align landing headline with post promise, reduce steps, improve load speed |
| Great organic post, weak paid | Ad settings, audience, creative fatigue | Paid CPM up and CPA up vs baseline | Test new audience, refresh first 3 seconds, rotate creatives weekly |
Concrete takeaway: do not “fix” a post that already converts. If CPA is good, prioritize scaling distribution through whitelisting or paid amplification instead of rewriting creative.
Example calculations: CPM, CPV, CPA, and engagement rate
Numbers become persuasive when you show the math. Keep formulas in the report so anyone can audit your conclusions. That transparency also reduces back-and-forth when finance or leadership asks how you got to a cost figure. Use these simple examples as copy-ready snippets for your October 2024 deck.
- Engagement rate (by reach): If a post reached 40,000 people and got 2,000 total engagements, then ER = 2,000 / 40,000 = 0.05 or 5%.
- CPM: If you spent $600 to get 120,000 impressions, then CPM = (600 / 120,000) x 1000 = $5.
- CPV: If you spent $300 and got 50,000 video views, then CPV = 300 / 50,000 = $0.006.
- CPA: If you spent $1,200 and got 80 purchases, then CPA = 1,200 / 80 = $15.
Concrete takeaway: always pair CPM or CPV with a downstream metric (CTR, conversion rate, or CPA). Cheap reach is not a win if it does not move the business goal.
Influencer and creator add-ons: whitelisting, usage rights, exclusivity
If October included influencer posts, your report should separate “creator performance” from “distribution choices.” A creator can deliver strong content, but the brand may limit results by skipping whitelisting or underinvesting in amplification. Conversely, heavy spend can hide weak creative. Track these variables explicitly so you can negotiate better deals next cycle.
- Whitelisting check – note whether the post was eligible for paid amplification, the spend level, and the audience used.
- Usage rights check – log where the content was reused (ads, email, landing pages) and for how long.
- Exclusivity check – record category and duration, then estimate the opportunity cost if it limited creator availability.
Concrete takeaway: when a creator post outperforms your brand baseline on saves and shares, ask for paid usage rights for 30 to 90 days and test it as an ad. That is often cheaper than commissioning new creative.
For more reporting templates and measurement ideas you can adapt, review the guides in the InfluencerDB Blog and standardize your reporting language across teams.
Common mistakes in monthly post reporting (and how to avoid them)
Most reporting failures are process failures, not math failures. The same issues show up across brands and creators: inconsistent definitions, missing context, and conclusions that cannot be acted on. Fixing these is usually a one-hour cleanup that pays off all year. Use the list below as a pre-flight check before you share the October report.
- Mixing denominators – switching between ER by reach and ER by impressions without labeling it.
- Ignoring format differences – comparing a carousel to a short-form video as if they behave the same.
- Cherry-picking winners – highlighting top posts without showing the median and bottom quartile.
- No annotation – failing to note boosts, collabs, giveaways, or news cycles that changed performance.
- Overweighting likes – treating likes as the main signal when shares, saves, and watch time often predict outcomes better.
Concrete takeaway: add a one-line “context note” field for every post in your dataset (boosted yes or no, collab yes or no, creator yes or no). That single column prevents bad conclusions later.
Best practices for October 2024 insights you can actually use in November
Once the report is clean, turn it into a plan. The best teams treat monthly reporting as a feedback loop: creative learns what hooks worked, social learns what cadence held, and growth learns what offers converted. To keep the loop tight, translate insights into a small number of repeatable actions. Then track whether those actions improved the next month’s median performance, not just one lucky post.
- Write three hypotheses – for example, “Shorter intros increase completion rate,” then design posts to test it.
- Standardize naming – tag posts by topic, hook type, and CTA so you can segment quickly.
- Report medians – include median reach and median ER to reduce the influence of outliers.
- Separate organic vs paid – keep two rows for the same creative if it ran as an ad.
- Document measurement rules – for ad attribution and conversion windows, align with platform guidance.
Concrete takeaway: if you only have time for one improvement, start reporting medians by format. It immediately reveals whether your “strategy” is working or if you are relying on rare spikes.
Data integrity and compliance notes (what to cite, what to store)
Reporting is also about defensibility. If you are using platform analytics, keep screenshots or exports for the month in case numbers update later. For influencer work, store contracts and usage rights terms alongside performance so you can reuse content legally. When you share results publicly, avoid exposing personal data or private creator earnings unless you have explicit permission.
For disclosure and endorsement basics, reference the FTC Endorsement Guides and influencer marketing guidance so your reporting and briefs reflect what creators must disclose. If you need a consistent definition of core ad metrics and how platforms calculate them, cross-check with Google Ads help documentation on impressions and interactions when aligning paid reporting language across channels.
Concrete takeaway: keep a single “source of truth” folder for October exports, contracts, and creative files. When someone questions a number in January, you will have the evidence in minutes.
October 2024 action plan: what to do next week
Close the report with a short plan that assigns owners. This is where reporting becomes operational. Keep it simple: three repeats, three stops, three tests. If you run influencer campaigns, add one negotiation change based on what you learned about performance by deliverable type.
- Repeat – replicate the top two hooks and the top performing content pillar, using the same format and length.
- Stop – pause the bottom quartile topic or format for two weeks unless it serves a non-performance goal.
- Test – run one controlled test per week: hook variant, CTA placement, and posting time.
- Amplify – whitelist the best creator post and allocate a small test budget with a clear CPA target.
- Improve tracking – add UTM parameters and a consistent naming convention for every post and creator.
Concrete takeaway: schedule the November tests at the same time you publish the October report. Otherwise, insights will sit in a document and never change outcomes. For reference, see Google Ads help documentation on impressions and interactions.