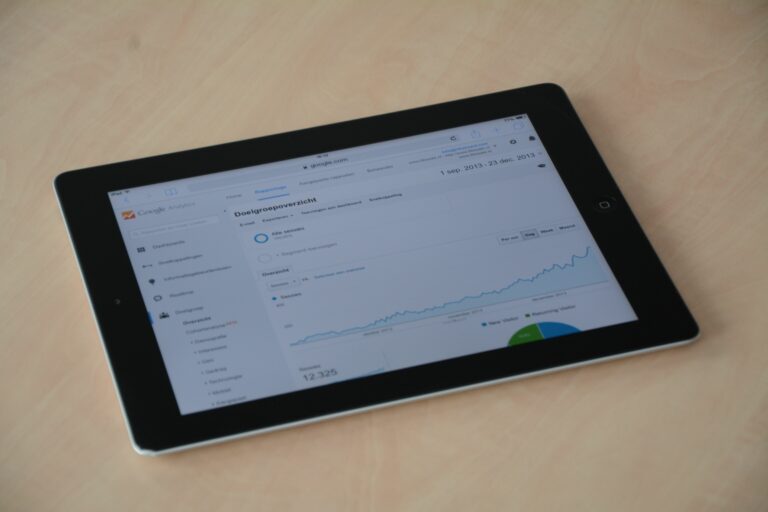

YouTube Analytics is the fastest way to stop guessing and start improving videos based on what viewers actually do. For creators, it shows which topics earn attention and which intros lose it. For brands and marketers, it helps you validate creator performance beyond vanity views and forecast outcomes for sponsorships. In this guide, you will learn the core metrics, the definitions that matter in influencer work, and a repeatable workflow for turning dashboards into decisions. Along the way, you will get formulas, benchmarks, and a few negotiation rules you can use immediately.
Core terms you need before you read any report
Before you interpret charts, lock in a shared vocabulary with your team or partners. Otherwise, you will argue about results instead of improving them. Start with reach and impressions: reach is the number of unique people who saw content, while impressions are the number of times a thumbnail was shown, including repeats. Engagement rate is typically interactions divided by views or reach, but on YouTube you often treat engagement as likes, comments, and shares relative to views, then compare it to watch time and retention. CPM is cost per thousand impressions, CPV is cost per view, and CPA is cost per action such as a purchase or email signup. Finally, whitelisting means a brand runs ads through a creator’s handle, usage rights define how long and where content can be reused, and exclusivity limits a creator from working with competitors for a period.
Two terms confuse people most on YouTube: watch time and average view duration. Watch time is total minutes watched across all viewers, while average view duration is watch time divided by views. In practice, YouTube’s recommendation system tends to reward videos that keep people watching, so watch time and retention often matter more than raw views. Also, remember that “views” are not the same as “qualified views” for a brand. If a viewer drops before the product mention, that view has limited value, which is why retention graphs are so useful in sponsored content.
How YouTube Analytics works: the reports that actually change outcomes

YouTube Studio offers many tabs, but you can get 80 percent of the value by focusing on four areas: Overview, Reach, Engagement, and Audience. Overview tells you whether a video is gaining momentum or flattening out. Reach is where you diagnose packaging problems: impressions, click-through rate, and traffic sources. Engagement is where you diagnose content problems: watch time, retention, and top moments. Audience is where you validate fit: returning viewers, new viewers, and when your audience is online.
To avoid getting lost, pick one question per tab. In Reach, ask: are people clicking when they see the thumbnail? In Engagement, ask: where do they leave, and what keeps them watching? In Audience, ask: who is this video for, and did it bring the right people back? When you work with creators for influencer campaigns, this structure also helps you request the right screenshots or exports, because you can map each question to a specific chart instead of asking for “all analytics.” For official definitions and measurement notes, YouTube’s own help documentation is the best reference: YouTube Help.
YouTube Analytics for growth: a step-by-step weekly workflow
A reliable workflow beats occasional deep dives. Use this weekly routine to improve performance without overreacting to noise. Step 1: pick a time window you will always use, such as the first 48 hours and first 7 days after publish, so comparisons are fair. Step 2: review impressions, click-through rate, and average view duration together, because a high CTR with low retention can still underperform. Step 3: open the audience retention graph and mark the first major drop, then write down what happened on screen at that timestamp. Step 4: check traffic sources to see whether Browse, Suggested, Search, or External drove the views, because each source implies a different optimization lever.
Step 5: compare the video to your last 10 uploads, not to your best-ever outlier. You are looking for repeatable patterns, like a certain format that consistently holds 45 percent retention at 30 seconds. Step 6: write one change you will test in the next upload, such as a shorter intro, earlier payoff, or a clearer thumbnail promise. Step 7: track outcomes in a simple sheet: topic, hook style, video length, CTR, average view duration, and subscribers gained per 1,000 views. If you want more frameworks like this for creator and brand decision-making, the InfluencerDB Blog regularly publishes practical playbooks you can adapt to your own reporting.
Benchmarks table: what “good” looks like for key metrics
Benchmarks vary by niche, video length, and traffic source, so treat these as starting ranges, not rules. Still, having a baseline helps you spot when a video is failing because of packaging versus content. Use the table below to set expectations and to write clearer briefs for creators. For example, if a sponsor requires a mid-roll product demo, you can plan for a retention dip and compensate with a stronger hook or a faster payoff.
| Metric | Why it matters | Healthy starting range | Action if low |
|---|---|---|---|
| Impressions click-through rate (CTR) | Measures thumbnail and title promise | 3% to 8% (varies by source) | Test new thumbnail, tighten title, align promise with first 15 seconds |
| Average view duration | Proxy for content satisfaction | 30% to 55% of video length | Cut slow setup, move value earlier, add pattern interrupts |
| Audience retention at 30 seconds | Diagnoses hook strength | 60% to 80% | Shorten intro, show outcome first, remove channel housekeeping |
| Watch time | Strong signal for recommendations | Upward trend across uploads | Increase session time with end screens, series formats, stronger pacing |
| Subscribers gained per 1,000 views | Measures audience-product fit | 1 to 10 (niche dependent) | Clarify channel positioning, add explicit subscribe moment after value |
Decision rule: if CTR is low but retention is strong, your content is good but your packaging is weak. If CTR is strong but retention collapses early, your packaging is overpromising or your intro is slow. If both are low, change the topic selection and the format, not just the thumbnail.
Turning metrics into money: CPM, CPV, CPA with simple formulas
When you evaluate sponsorships, you need a consistent way to translate performance into pricing. CPM is the most common for awareness, CPV is useful for skippable placements or Shorts, and CPA is best when the brand can track conversions. Here are the basic formulas you can use in negotiations and post-campaign reporting. CPM = (Cost / Impressions) x 1000. CPV = Cost / Views. CPA = Cost / Actions. The key is to define the denominator clearly, such as 30-second views for a longer integration, or link clicks for a performance push.
Example calculation: a creator charges $2,500 for a dedicated video. The video earns 80,000 views and 200,000 impressions. CPV is $2,500 / 80,000 = $0.031. CPM based on impressions is ($2,500 / 200,000) x 1000 = $12.50. If the brand tracks 150 purchases, CPA is $2,500 / 150 = $16.67. Now you can compare options: a higher CPM might still be worth it if the audience match is strong and retention through the product segment is high. For a more standardized view of digital measurement concepts, the IAB’s resources are a solid reference point: Interactive Advertising Bureau.
For influencer deals, add two adjustments. First, account for usage rights: if the brand wants to reuse the video in ads or on product pages, price should increase because the content becomes an asset. Second, account for exclusivity: if the creator cannot work with competitors, you are buying opportunity cost. A practical rule is to separate “media value” (views, impressions) from “production value” (time, editing, scripting) and “rights value” (usage, whitelisting, exclusivity). That structure keeps negotiations rational even when performance varies.
Audit a creator with YouTube Analytics: a checklist for brands
If you are a brand or agency, you do not need every metric. You need proof of audience fit, proof of consistent delivery, and proof that the creator can integrate a message without losing viewers. Ask for the last 10 videos’ key stats: views, average view duration, retention at 30 seconds, and traffic sources. Then ask for one audience screenshot: top geographies, age ranges, and returning versus new viewers. Finally, request a retention graph for a sponsored video if possible, because it shows whether the creator can hold attention through an ad read.
Use this checklist to score a channel quickly:
- Consistency: Are views stable across uploads, or is performance dependent on rare spikes?
- Packaging skill: Does CTR stay in a healthy range across topics, suggesting repeatable thumbnail and title craft?
- Content control: Does retention drop at predictable points, and does the creator fix those issues over time?
- Audience match: Do top countries and age ranges align with your shipping and targeting constraints?
- Conversion readiness: Does the creator drive clicks, comments asking for links, or measurable actions?
One more safeguard: validate that the audience is real and engaged. Sudden view spikes from low-quality external sources can inflate totals without delivering brand lift. Look for a healthy mix of Browse and Suggested traffic, plus returning viewers over time. If most views come from a single external source, ask what it is and whether it is repeatable.
Reporting table: a sponsor-ready template that ties metrics to decisions
Creators often send brands a screenshot dump, which makes it hard to see what worked. Instead, use a compact report that connects each metric to an insight and a next step. The table below doubles as a campaign recap and a learning log you can reuse across partnerships.
| Section | Metric to report | What it means | What you do next |
|---|---|---|---|
| Packaging | Impressions, CTR | How well the title and thumbnail earned the click | Test 2 thumbnail variants, align first 10 seconds with the promise |
| Attention | Watch time, average view duration | Whether viewers stayed long enough to absorb the message | Move key points earlier, cut slow sections, add chapters |
| Integration quality | Retention at sponsor mention timestamp | How much attention the brand segment retained | Try a faster transition, product demo, or story-based placement |
| Audience fit | Top geos, returning viewers | Whether the video reached the intended market and loyal fans | Adjust creator mix, refine brief, shift to a series format |
| Outcomes | Clicks, conversions, CPA | Business impact beyond views | Improve offer, landing page, and CTA timing |
Tip: include one sentence per row explaining the “why.” Brands remember insights, not raw numbers. Also, keep a consistent reporting window, such as 7-day and 30-day performance, so you can compare campaigns fairly.
Common mistakes that make YouTube Analytics misleading
First, people optimize for views when they should optimize for watch time and retention. A video can spike in views from a trending topic and still fail to build a loyal audience. Second, teams compare a 9-minute tutorial to a 45-second Short and draw conclusions from the wrong denominator. Always segment by format and length. Third, creators sometimes change titles and thumbnails without noting the timing, which makes CTR trends hard to interpret. Keep a simple change log so you can connect cause and effect.
Another frequent error is treating averages as truth. Average view duration hides distribution: some viewers may watch the whole video while many leave instantly. Use the retention curve to see the shape. Finally, brands sometimes demand strict talking points that damage retention, then blame the creator for performance. If the brief forces a slow intro or legal-heavy language, expect a drop and plan the integration creatively instead.
Best practices: how to use analytics to improve the next upload
Start with a hypothesis, not a hunch. For example: “If we show the final result in the first 5 seconds, retention at 30 seconds will increase by 10 points.” Then test one change at a time so you can attribute results. Use chapters to improve navigation for long videos, and watch how they affect retention and rewatches. Also, build series formats because they increase session time and make end screens more effective. When you publish, pair the video with a pinned comment and a clear CTA that matches the viewer’s intent at that moment.
For sponsored content, place the product where it naturally solves a problem in the narrative. A tool mention during a tutorial step usually retains better than a standalone ad read. If the brand needs a specific message, translate it into a viewer benefit and show proof quickly. Then, after the campaign, renegotiate based on outcomes using the CPM, CPV, or CPA math you already defined. If you need a policy reference for disclosures in sponsored videos, review the FTC’s guidance: FTC Endorsement Guides.
Quick action plan: what to do today
If you want immediate progress, do these five tasks in one hour. Pull your last five videos and write down CTR, average view duration, and retention at 30 seconds. Identify the single biggest early drop-off point across those videos and note what caused it, such as a long logo animation or a slow explanation. Next, pick one thumbnail style that performed best and reuse its structure for your next upload. Then, script your first 20 seconds to deliver the payoff earlier, because that is where most retention is won or lost. Finally, set a reporting template like the table above so every upload teaches you something you can repeat.