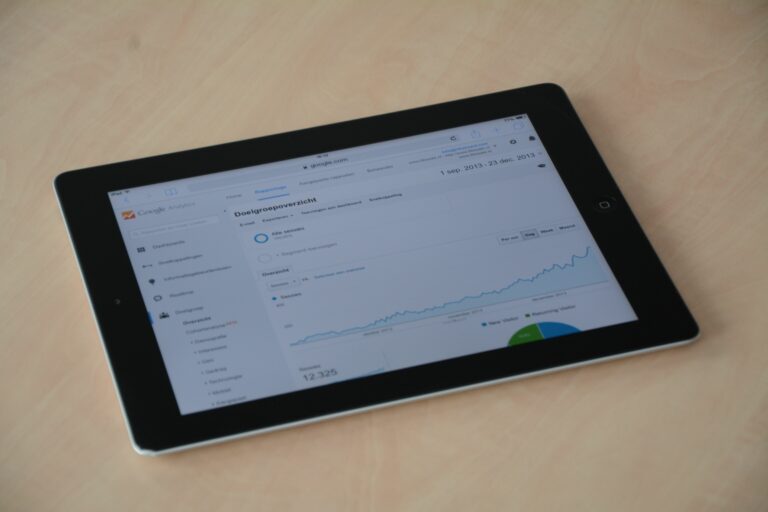

Business intelligence reporting is how influencer teams turn scattered campaign data into decisions that protect budget and prove growth. Instead of exporting screenshots and arguing over vanity metrics, you build a repeatable reporting system that connects creator activity to reach, engagement, traffic, conversions, and revenue. The goal is not a prettier dashboard – it is a single source of truth that leadership trusts. In practice, that means consistent definitions, clean data, and a cadence that answers the same questions every week. This guide shows what to track, how to calculate it, and how to present it so your next budget conversation is simple.
Business intelligence reporting: what it is and what it is not
At its core, business intelligence reporting means collecting data from multiple sources, modeling it into consistent tables, and visualizing it so stakeholders can act. For influencer marketing, those sources usually include creator deliverables, platform analytics, tracking links, promo codes, ecommerce or CRM data, and paid amplification results. A BI report is not a one-off slide deck, and it is not a spreadsheet that only one person understands. It is a system: definitions, pipelines, dashboards, and a feedback loop that improves campaign execution. If your team debates what counts as a “view” or whether “reach” includes paid, you do not have BI yet – you have opinions.
To ground the system, start with three questions your report must answer every time: What did we buy (deliverables and spend)? What did we get (attention and actions)? What did it change (revenue, retention, or brand lift)? Once those are stable, you can add nuance like creative learnings, audience overlap, and incrementality. For more measurement and planning ideas you can apply to your own stack, browse the InfluencerDB blog on influencer analytics and reporting and save the posts that match your workflow.
Define the metrics early: a practical glossary for stakeholders

BI breaks down when teams use the same word to mean different things. Define these terms in your report’s first tab or dashboard description, then keep them consistent across campaigns. If a platform changes a definition, note the date of the change and avoid mixing pre-change and post-change numbers in the same trend line. Here are the core terms most influencer programs need.
- Reach: unique accounts exposed to content. Use platform-reported reach when available; otherwise estimate cautiously and label it as estimated.
- Impressions: total times content was shown, including repeats. Impressions are usually higher than reach.
- Engagement rate (ER): engagements divided by impressions or reach. Pick one denominator and stick with it. Formula example: ER by impressions = (likes + comments + shares + saves) / impressions.
- CPM: cost per thousand impressions. Formula: CPM = (spend / impressions) * 1000.
- CPV: cost per view. Define “view” by platform (for example, 3-second view vs completed view) and label it. Formula: CPV = spend / views.
- CPA: cost per acquisition (purchase, signup, app install, etc.). Formula: CPA = spend / conversions.
- Whitelisting: creator grants access for a brand to run ads through the creator’s handle or content, typically via platform permissions.
- Usage rights: permission to reuse creator content (organic, paid, email, web) for a defined duration and geography.
- Exclusivity: restriction preventing the creator from working with competitors for a period of time, often priced separately.
One decision rule that prevents confusion: define “spend” as the sum of creator fees, product cost (if material), agency fees (if you want fully loaded), and paid amplification. Then show both “creator-only spend” and “total program spend” in the dashboard so finance and marketing can each get what they need.
Map your data sources and build a clean reporting model
Before you build charts, map where each metric comes from and how often it updates. Influencer reporting usually fails because the data model is inconsistent: creator names do not match across tools, campaign names are free-typed, and tracking parameters are missing. Fixing the model is unglamorous, but it is where BI earns its keep. Start with a campaign taxonomy and enforce it in contracts, briefs, and tracking links.
Use a simple star schema approach: one fact table for performance and several dimension tables for creators, content, campaigns, and dates. Your fact table might have one row per creator per post per day, or one row per post with cumulative totals, depending on your cadence. Dimension tables hold stable attributes like creator handle, platform, niche, region, and rate tier. This structure makes it easier to slice results by platform, creator segment, or product line without rewriting formulas every time.
Concrete setup checklist:
- Create a Campaign ID and require it in every brief, invoice, and tracking link.
- Standardize UTM parameters for all outbound links (source, medium, campaign, content).
- Maintain a Creator ID that survives handle changes and merges duplicates.
- Store deliverables as structured fields (post type, count, due date) instead of notes.
- Log rights (usage term, whitelisting yes or no, exclusivity window) so you can explain pricing and reuse.
If you need a reference for how Google expects UTMs to be structured, use the official guide: Google Analytics Campaign URL Builder documentation. Put the UTM rules into your influencer brief template so creators and agencies do not improvise.
KPIs that executives care about – and how to calculate them
Influencer teams often over-index on engagement because it is easy to get. BI reporting should still include it, but it must ladder up to outcomes. A useful dashboard separates efficiency (cost to generate attention or action) from impact (incremental revenue, new customers, retention). When you cannot measure incrementality, be explicit about what your numbers represent: attributable, not incremental.
Here are practical KPI formulas you can put directly into your model:
- CPM = (Total spend / Total impressions) * 1000
- CTR = Clicks / Impressions
- CVR = Conversions / Clicks
- ROAS (attributable) = Revenue attributed / Spend
- MER (marketing efficiency ratio) = Total revenue / Total marketing spend (useful at program level)
- New customer rate = New customers / Total customers from campaign
- LTV:CAC = Customer lifetime value / Customer acquisition cost (requires cohorting)
Example calculation: you pay $12,000 in creator fees and $3,000 in whitelisted spend, so total spend is $15,000. The content generates 1,200,000 impressions and 9,600 clicks. CPM = (15,000 / 1,200,000) * 1000 = $12.50. CTR = 9,600 / 1,200,000 = 0.8%. If those clicks drive 240 purchases, CVR = 240 / 9,600 = 2.5%. If attributed revenue is $24,000, attributable ROAS = 24,000 / 15,000 = 1.6. That is a clean story: cost to reach, cost to drive traffic, and what the traffic returned.
| KPI | What it answers | Formula | When to use it |
|---|---|---|---|
| CPM | Are we buying attention efficiently? | (Spend / Impressions) * 1000 | Top of funnel, awareness flights |
| CPV | Are video views cost-effective? | Spend / Views | Video-first launches, creative testing |
| CPA | What does a conversion cost? | Spend / Conversions | Performance partnerships, promo pushes |
| Attributable ROAS | Did tracked revenue exceed spend? | Attributed revenue / Spend | Direct response, ecommerce |
| New customer rate | Are we acquiring new buyers? | New customers / Total customers | Prospecting, category expansion |
Dashboard design that prevents bad decisions
A BI dashboard should reduce debate, not create it. The simplest way to do that is to separate reporting views by audience. Executives need a one-page narrative with spend, outcomes, and the next decision. Channel managers need creator and creative-level detail to optimize. Finance needs reconciliation: invoices, accruals, and what was delivered. Put those views on separate tabs, but keep them tied to the same underlying model.
Use a consistent hierarchy: program level – campaign level – creator level – post level. Then add filters for platform, market, product, and date. Avoid mixing metrics with different time windows in the same chart; for example, do not compare 7-day click revenue to lifetime revenue without labeling it. Also, show confidence signals: number of posts, number of creators, and percent of spend with tracking coverage. That last one is a quiet killer in influencer programs.
Practical dashboard components to include:
- Scorecard: spend, impressions, clicks, conversions, revenue, ROAS, CPA.
- Coverage panel: percent of posts with UTMs, percent with promo codes, percent with platform analytics captured.
- Top movers: creators and posts driving the most incremental clicks or lowest CPA.
- Creative tags: hook type, format, offer, CTA, product featured – so you can learn, not just report.
If you are aligning dashboards with platform policy and data access, keep an eye on official documentation for permissions and measurement constraints. For example, Meta’s guidance on measurement and attribution is a useful reference point for how platforms think about reporting: Meta Business Help Center.
A step-by-step framework for influencer BI reporting
This workflow is designed for small teams that need rigor without building a data warehouse from scratch. You can implement it in phases: start with a spreadsheet plus a BI tool, then automate ingestion later. The key is to lock definitions and IDs before you scale volume.
- Set the reporting contract: decide the KPIs, the definitions, and the cadence (weekly pulse, monthly review, post-campaign readout).
- Standardize inputs: enforce campaign IDs, creator IDs, UTMs, and deliverable fields in your briefing and contracting process.
- Collect data: pull platform metrics, link clicks, code redemptions, and ecommerce outcomes. Store raw exports as backups.
- Normalize and validate: dedupe creators, map handles, check for missing UTMs, and flag outliers like impossible engagement spikes.
- Model the data: build fact and dimension tables, then calculate KPIs in one place so every chart uses the same math.
- Publish dashboards: create role-based views and annotate major changes (new offer, new landing page, tracking fix).
- Close the loop: convert learnings into next actions, such as shifting budget to a format, changing briefs, or renegotiating usage rights.
Decision rule to keep you honest: if a KPI changes, your report must show whether the change came from spend, volume (impressions or clicks), or conversion rate. That simple decomposition prevents teams from crediting creative for what was really just higher budget.
| Reporting layer | Primary question | Metrics to show | Owner | Action output |
|---|---|---|---|---|
| Executive summary | Is the program working? | Spend, revenue, ROAS, CPA, new customer rate | Program lead | Budget decision, next test plan |
| Campaign view | Which campaigns beat targets? | CPM, CTR, CVR, CPA, creative tags | Campaign manager | Scale or pause, brief updates |
| Creator view | Who should we rebook? | Cost per click, cost per purchase, audience fit, fraud flags | Influencer manager | Renewal list, rate guidance |
| Content view | What creative pattern wins? | Hook, watch time proxy, saves, shares, comments quality | Creative strategist | Creative playbook updates |
| Finance view | Did we get what we paid for? | Invoice status, deliverable completion, rights terms | Ops or finance partner | Accruals, compliance follow-ups |
Common mistakes that break reporting credibility
Most influencer reporting problems are not technical. They are process gaps that show up as missing data, inconsistent definitions, and charts that cannot be reconciled to invoices. Fixing these issues often delivers a bigger ROI than switching tools. If your leadership has stopped trusting influencer numbers, start here and rebuild confidence with a few clean cycles.
- Mixing attribution windows: combining 1-day view-through with 7-day click-through without labeling it.
- Counting boosted impressions as organic: paid amplification should be split or clearly marked.
- Reporting averages without distribution: a mean CPA hides whether one creator carried the campaign.
- Ignoring tracking coverage: if only 60% of posts have UTMs, your ROAS is not a program ROAS.
- Not accounting for rights: comparing a creator with full usage rights to one without, then calling one “expensive.”
- Letting creators self-report without validation: screenshots are fine as backup, but pull platform data where possible.
Compliance can also affect measurement. If disclosures are inconsistent, performance can shift and your report will not explain why. The FTC’s endorsement guidance is a solid baseline for teams building consistent creator briefs: FTC endorsements and influencer guidance.
Best practices: make BI reporting a competitive advantage
Once the basics work, the best teams use BI to negotiate better deals and improve creative outcomes. They treat reporting as a product: it has users, requirements, and iterations. Importantly, they do not wait until the campaign ends to learn. They monitor early signals, then adjust briefs, landing pages, and paid support while there is still time to change the result.
- Tag creative consistently: hook style, offer type, CTA, product, and format. Then report performance by tag to build a playbook.
- Separate prospecting vs retargeting: whitelisted ads often blend audiences, so keep segments distinct in reporting.
- Use medians for creator benchmarks: medians resist outliers and make rate guidance more stable.
- Track retention cohorts: if you can, measure repeat purchase or subscription retention by campaign source.
- Document assumptions: when you estimate reach or allocate revenue across touchpoints, write it down in the dashboard.
Practical negotiation tip: when a creator’s fee looks high on CPM, check whether the deal includes usage rights, whitelisting access, or exclusivity. If it does not, you can often trade a lower fee for a limited usage term, or keep the fee and add whitelisting so you can improve performance with paid. BI reporting gives you the evidence to make that trade with confidence.
What to do next: a simple 30-day rollout plan
You do not need a perfect data warehouse to start. You need a consistent model, a few non-negotiable inputs, and a dashboard that answers the same questions every time. Over 30 days, focus on building trust: reconcile spend to invoices, reconcile performance to platform totals, and show coverage so stakeholders understand the limits. After that, automation and experimentation become much easier to justify.
- Week 1: lock metric definitions, campaign taxonomy, and UTM rules. Add them to your brief and contract templates.
- Week 2: build your base tables: creators, campaigns, deliverables, spend, and performance. Validate with one completed campaign.
- Week 3: publish a first dashboard with scorecard, coverage, and top creators. Run a review meeting and capture questions.
- Week 4: add creative tags and a simple decomposition view (spend vs CTR vs CVR). Then set a recurring cadence.
When your reporting system is stable, you can move from “what happened” to “what should we do next.” That is the real promise of business intelligence reporting in influencer marketing: fewer arguments, faster learning, and budgets that grow because the story is backed by data.