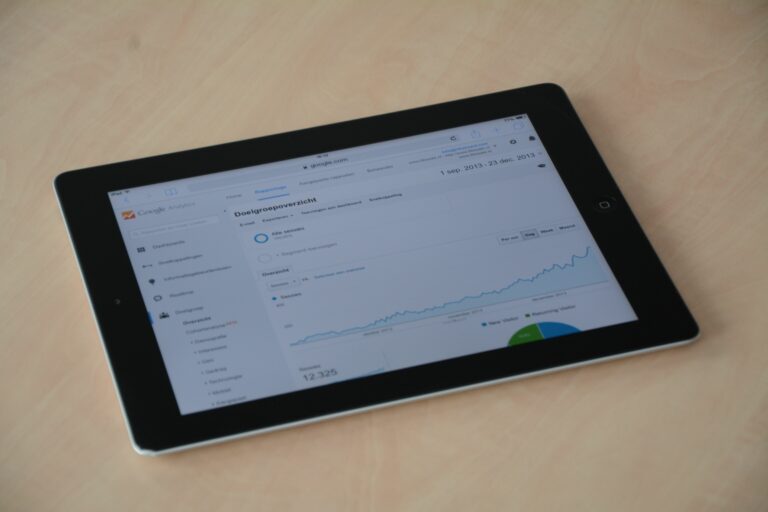

Ecommerce benchmark report is the fastest way to sanity-check your influencer program before you spend another dollar. Instead of arguing over “good” performance, you compare your results to realistic ranges for reach, engagement rate, CPM, CPV, and CPA, then decide what to fix. In this guide, you will get practical definitions, benchmark tables you can actually use, and a step-by-step method to turn messy creator results into clear targets. Along the way, you will learn how to price deliverables, how to audit tracking, and how to negotiate usage rights without overpaying. If you want more examples and templates, the InfluencerDB Blog is a useful place to cross-check tactics by platform.
Ecommerce benchmark report basics: the terms you must define first
Benchmarks only work when everyone uses the same language, so start by defining the metrics in your brief and reporting. Otherwise, one creator reports “views” while your team expects “impressions,” and your CPA math breaks. Use the definitions below in your campaign doc and require creators and agencies to follow them. Then, lock your attribution window and your source of truth (platform analytics, Shopify, GA4, or your affiliate platform). Finally, keep a simple glossary in the first page of your report so stakeholders stop debating terms and start debating decisions.
- Reach – unique accounts that saw the content at least once.
- Impressions – total times the content was shown, including repeats.
- Engagement rate (ER) – engagements divided by impressions or followers (pick one and stick to it). A common choice for posts is engagements / impressions.
- CPM (cost per mille) – cost per 1,000 impressions. Formula: Spend / (Impressions / 1000).
- CPV (cost per view) – cost per video view (define view as platform-defined, not “3-second” unless you specify). Formula: Spend / Views.
- CPA (cost per acquisition) – cost per purchase (or lead). Formula: Spend / Conversions.
- Whitelisting – running paid ads through a creator’s handle (also called creator licensing). This is separate from organic posting fees.
- Usage rights – permission to reuse creator content (for ads, email, site, Amazon listings) for a defined time and territory.
- Exclusivity – creator agrees not to work with competitors for a defined time and category scope.
For platform definitions of impressions, reach, and video views, align your reporting with official documentation such as YouTube’s view and analytics help. That way, when performance swings, you can rule out measurement drift before you change strategy.
Benchmarks that matter for ecommerce: what “good” looks like by goal

Not every campaign should chase the same benchmark. A seeding push for awareness can tolerate a higher CPA because you are buying creative and reach, while an affiliate-heavy program should be ruthless on CPA and conversion rate. Therefore, set benchmarks by objective first, then by platform and creator tier. Also, keep two ranges: a “healthy” band (what you expect) and an “exceptional” band (what you celebrate but do not budget as the norm). The table below gives practical starting points for ecommerce, assuming creators are a mix of lifestyle and product-led content and you are not heavily boosting with paid spend.
| Objective | Primary KPI | Healthy benchmark range | What to do if you miss |
|---|---|---|---|
| Awareness (new product) | CPM, reach | $8 to $25 CPM on short-form video; reach rate 20% to 60% of followers | Improve hook and first 2 seconds; test different creator fit; add whitelisting only after organic proof |
| Consideration (education) | CPV, saves, link clicks | $0.01 to $0.06 CPV; saves per 1,000 impressions: 2 to 10 | Ask for clearer demo, price anchoring, and FAQ handling; add landing page matched to the script |
| Conversion (promo) | CPA, conversion rate | CPA within 1.0x to 1.8x your paid social CPA; site conversion rate 1% to 4% | Fix offer clarity, shipping thresholds, and checkout friction; shift budget to creators with proven audience intent |
| Retention (repeat purchase) | Repeat rate, AOV | Repeat purchase lift 5% to 15% among exposed cohorts; AOV +5% with bundles | Use creators for routines, refills, and bundles; retarget viewers with email and SMS flows |
Use these ranges as a first pass, then tighten them using your own history. After three to five campaigns, your internal benchmark will beat any industry average because it reflects your price point, shipping, and creative style.
Ecommerce benchmark report by platform and creator tier (pricing and performance)
Platform mechanics shape both pricing and outcomes. TikTok can deliver cheap views but volatile conversion, while Instagram often drives steadier traffic for established brands. YouTube tends to cost more per deliverable, yet it can win on intent and long-tail sales. Because of that, your report should separate benchmarks by platform and by creator size. The next table gives directional benchmarks for ecommerce influencer content when you pay a flat fee for organic posting (not including paid amplification). Treat them as negotiation anchors, not rigid rules.
| Platform | Creator tier | Typical deliverable | Fee range (USD) | Expected ER (impressions-based) | Typical CPM equivalent |
|---|---|---|---|---|---|
| TikTok | Micro (10k to 50k) | 1 video | $250 to $1,000 | 4% to 10% | $6 to $18 |
| TikTok | Mid (50k to 250k) | 1 video | $1,000 to $4,000 | 3% to 8% | $8 to $22 |
| Micro (10k to 50k) | 1 Reel + 3 Stories | $400 to $1,500 | 2% to 6% | $10 to $28 | |
| Mid (50k to 250k) | 1 Reel + 3 Stories | $1,500 to $6,000 | 1.5% to 5% | $12 to $35 | |
| YouTube | Micro (10k to 50k) | Integrated mention (60 to 90s) | $800 to $3,000 | 1% to 4% (likes + comments / views) | $15 to $45 |
| YouTube | Mid (50k to 250k) | Integrated mention (60 to 90s) | $3,000 to $12,000 | 1% to 3% | $20 to $60 |
Concrete takeaway: in your report, always compute a CPM equivalent even when you pay per deliverable. It turns “$2,500 for a Reel” into a comparable media number, which makes budgeting and optimization much easier.
How to calculate CPM, CPV, and CPA (with simple ecommerce examples)
Numbers become persuasive when you show the math. Build a small calculation block in your ecommerce benchmark report and repeat it for every creator so stakeholders can audit the logic. Start with spend, impressions, views, clicks, and purchases, then compute CPM, CPV, and CPA. Next, compare each metric to your benchmark band and flag outliers. Finally, annotate the “why” in one sentence: weak hook, wrong audience, poor landing page match, or tracking gaps.
- CPM = Spend / (Impressions / 1000)
- CPV = Spend / Views
- CPA = Spend / Purchases
- Revenue = Purchases x AOV
- ROAS = Revenue / Spend
Example: You pay $1,200 for a TikTok video. It generates 120,000 views, 150,000 impressions, and 24 tracked purchases. Your AOV is $55.
- CPV = 1200 / 120000 = $0.01
- CPM = 1200 / (150000/1000) = 1200 / 150 = $8
- CPA = 1200 / 24 = $50
- Revenue = 24 x 55 = $1,320
- ROAS = 1320 / 1200 = 1.1
Decision rule: if CPV and CPM are strong but CPA is weak, do not blame the creator first. Instead, audit offer clarity, landing page speed, and checkout friction, because the top-of-funnel is working.
Tracking and attribution: make your benchmark report trustworthy
Benchmarks are useless if tracking is inconsistent. To fix that, standardize links and attribution before the campaign launches. Use UTM parameters on every link, keep promo codes unique per creator, and align your attribution window (for example, 7-day click and 1-day view, or whatever your stack supports). Also, document what “conversion” means: purchase, first purchase, subscription start, or qualified lead. When you present results, separate “platform-reported” metrics (views, reach) from “site-reported” metrics (sessions, purchases) so nobody confuses them.
Practical setup checklist you can copy into your brief:
- Create one UTM template and enforce it (source, medium, campaign, content).
- Assign one discount code per creator and one backup code for reposts.
- Use a dedicated landing page when the product needs education.
- Capture whitelisting spend separately from creator fees.
- Log posting time, link placement, and pinned comment status.
If you use GA4, keep your event naming consistent and confirm that purchase events fire correctly. For measurement standards and definitions, the Google Analytics documentation is a reliable reference to align teams on what is being counted.
Negotiation levers: usage rights, whitelisting, and exclusivity (and how to price them)
Many ecommerce teams overpay because they treat “content” as a single line item. In reality, you are buying multiple assets: the post, the creator’s distribution, and sometimes the right to reuse the video in ads or on your product page. Therefore, break pricing into components and negotiate each one. Start with the organic deliverable fee, then add usage rights, then add whitelisting, and only then discuss exclusivity. This structure keeps your benchmark report clean because you can compare like with like.
- Usage rights: price as a time-bound license. A practical range is 20% to 100% of the base fee depending on duration (30, 90, 180 days), channels (paid social, email, site), and territory.
- Whitelisting: charge a monthly access fee or a flat fee tied to duration. Common ranges are $250 to $1,500 per month for mid-tier creators, but the right number depends on demand and category sensitivity.
- Exclusivity: price based on opportunity cost. A simple method is to add 25% to 200% of the base fee depending on category scope and length.
Concrete takeaway: in your ecommerce benchmark report, include two CPAs – one for “creator fee only” and one for “all-in cost” (fee + usage + whitelisting). That prevents you from celebrating a low CPA that was only possible because you ignored licensing costs.
Common mistakes that distort ecommerce benchmarks
Most benchmark problems come from process, not math. One common mistake is mixing objectives in the same report, which makes a prospecting creator look “bad” next to a discount-code closer. Another is comparing creators using follower count instead of average views, which hides distribution differences. Teams also forget to separate organic performance from paid amplification, so CPM looks worse than it is. Finally, many programs accept screenshots without raw exports, which makes it hard to detect missing posts, deleted Stories, or inconsistent time windows.
- Using engagement rate by followers for Reels and TikTok, then comparing it to impressions-based ER elsewhere.
- Not normalizing for posting time, seasonality, or product availability.
- Counting “add to cart” as a purchase in one campaign and not in another.
- Letting creators choose any link format, which breaks UTMs and attribution.
- Ignoring returns and cancellations when reporting ROAS.
Fix one thing first: standardize your reporting window. For example, report platform metrics at 7 days post, and ecommerce conversions at 14 days post, then keep that rule for every campaign.
Best practices: how to turn benchmarks into better creative and better spend
Once your benchmarks are stable, use them to make decisions quickly. Start by building a simple scorecard: CPM, CPV, CTR, conversion rate, CPA, and ROAS. Then, tag each creator by content pattern (tutorial, unboxing, routine, comparison, problem-solution) and look for repeatable winners. Next, rebrief creators using what worked, but keep enough freedom for their voice. Over time, you will shift from “creator roulette” to a predictable system that improves month over month.
Actionable best practices you can apply this week:
- Write a hook requirement: first sentence must name the problem and the product category.
- Force one proof point: show texture, size, before-after, or a measurable claim with context.
- Match landing pages to scripts: if the creator says “bundle,” the page should open on the bundle.
- Scale with whitelisting only after organic proof: boost the top 20% of posts by CPV and saves, not by likes.
- Keep a control group: always run a few creators with the same offer so you can compare creative, not discounts.
Finally, document your learnings in a living playbook. A benchmark report is not a one-off PDF; it is a feedback loop that makes your next brief sharper and your next negotiation calmer.
A simple reporting template you can copy into your next ecommerce benchmark report
If you want your report to drive action, keep it consistent and short. Put the benchmark ranges at the top, list the creators, and show the math. Then, end with three decisions: who to rebook, what creative pattern to repeat, and what to stop doing. This structure also makes it easier to share results with finance and leadership because the logic is transparent. Use the checklist below as your closing section so every report ends with next steps, not just charts.
- Top performers (rebook list) with the single reason why they won.
- Underperformers with the single fix to test (offer, hook, landing page, creator fit).
- Budget shift recommendation (percent move, not vague language).
- Creative learnings (3 bullets max) with examples and timestamps.
- Measurement notes (tracking gaps, attribution changes, returns impact).
When you run the next campaign, keep your benchmark bands visible in the brief. That way, creators know what success looks like, and your team knows what to optimize first.