The like follower ratio is the engine under the hood of Instagram engagement. A creator with 50 k followers and 5 k likes per post (10 % LFR) is usually a safer bet than one flaunting half a million followers but barely scraping 4 000 likes (0.8 % LFR). Brands chasing social media ROI finally realise that quality of attention trumps quantity of eyeballs.
Today we’ll break down:
- What the metric really measures
- How to calculate it in under 30 seconds
- Benchmarks from nano all the way to celebrity accounts
- Red flags that numbers alone won’t show
Where to spot the raw numbers

Instagram stopped showing total likes publicly in some regions, but a creator’s internal dashboard (or a third‑party analytics view) still lists them. Jot down the like count — that’s the numerator in our upcoming micro‑math.
A real‑world example: Caro Daur’s vintage look
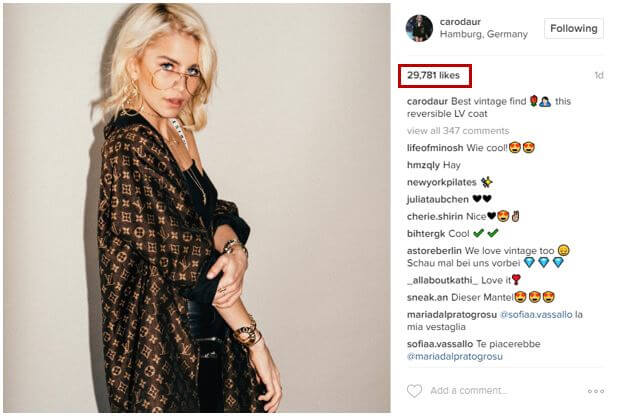
In late 2024 Caro’s vintage Louis Vuitton shot pulled 29 781 likes from 981 215 followers. The quick formula:
29 781 ÷ 981 215 = 0.0304 → 3.04 % LFR
Anything above 3 % in the macro tier (> 500 k followers) is gold. The like follower ratio here shows why macro accounts must fight harder for every genuine tap.
What’s a good like follower ratio in 2025?
- Nano (< 10 k followers) – 8 % +
- Micro (10 k–100 k) – 5 %–7 %
- Mid (100 k–500 k) – 3 %–4 %
- Macro (> 500 k) – 1.5 %–3 %
Why the sliding scale? The bigger the audience, the more casual scrollers outnumber die‑hard fans. LFR naturally compresses with size.
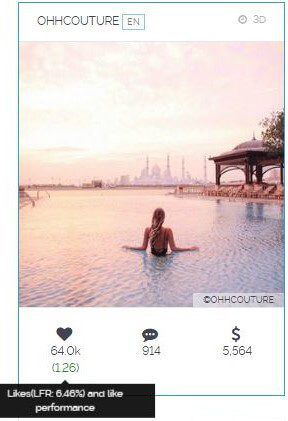
Engagement dashboards decode the trend
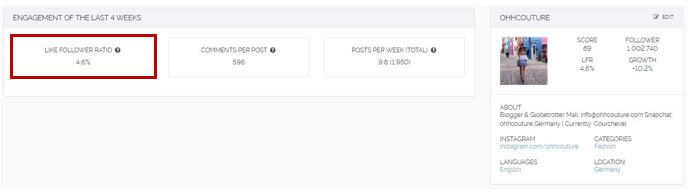
Over four weeks @ohhcouture clocked a 4.6 % like‑follower ratio, well above the 3 % macro average. That’s why her posts fetched $5 629 earned‑media value each — advertisers pay for proof, not hype.
Post‑Level Laser Focus: Tracking the Like Follower Ratio
Even if your 30‑day average looks mellow, a single runaway post recalibrates the narrative. Brands should request the last ten posts when vetting a creator, not just the topline account metric.
When micro beats mega: the @german_gems case
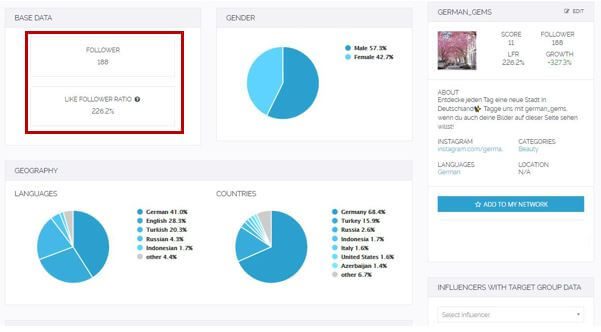
With just 189 followers, @german_gems scored a ridiculous 226.2 % LFR (double‑tapping superfans exist!). While nano reach is narrow, conversion rates often justify the smaller footprint.
Calculating the Like Follower Ratio in Bulk
- Export post data: likes & follower count.
- LFR = (total likes ÷ follower count) × 100.
- Repeat for each post or creator, then average across the desired time span.
Google Sheets users:
=ARRAYFORMULA((B2:B12 / C2:C12) * 100)
Where B is likes and C is followers.
Common red flags numbers hide
- Sudden 40 % follower jumps overnight → possible paid followers.
- Like spikes but zero new comments → engagement pods or automation.
- Perfectly round follower numbers → bulk‑buy packages.
Cross‑check with comment‑to‑like ratio and audience country split. Source: Later study on Instagram engagement trends
Learn more & keep refining
Need a deeper dive into revenue figures? Check our piece “The 2024 Pay‑Scale of Instagram’s Highest‑Paid Influencers & Their ROI.”
The road ahead
We’re baking a revamped analytics layer that auto‑flags suspicious LFR outliers and benchmarks your roster against industry tiers. Stay tuned—no spreadsheets soon.
Article brewed with two americanos, one CSV export, and a mild obsession with numbers that actually move the revenue needle.