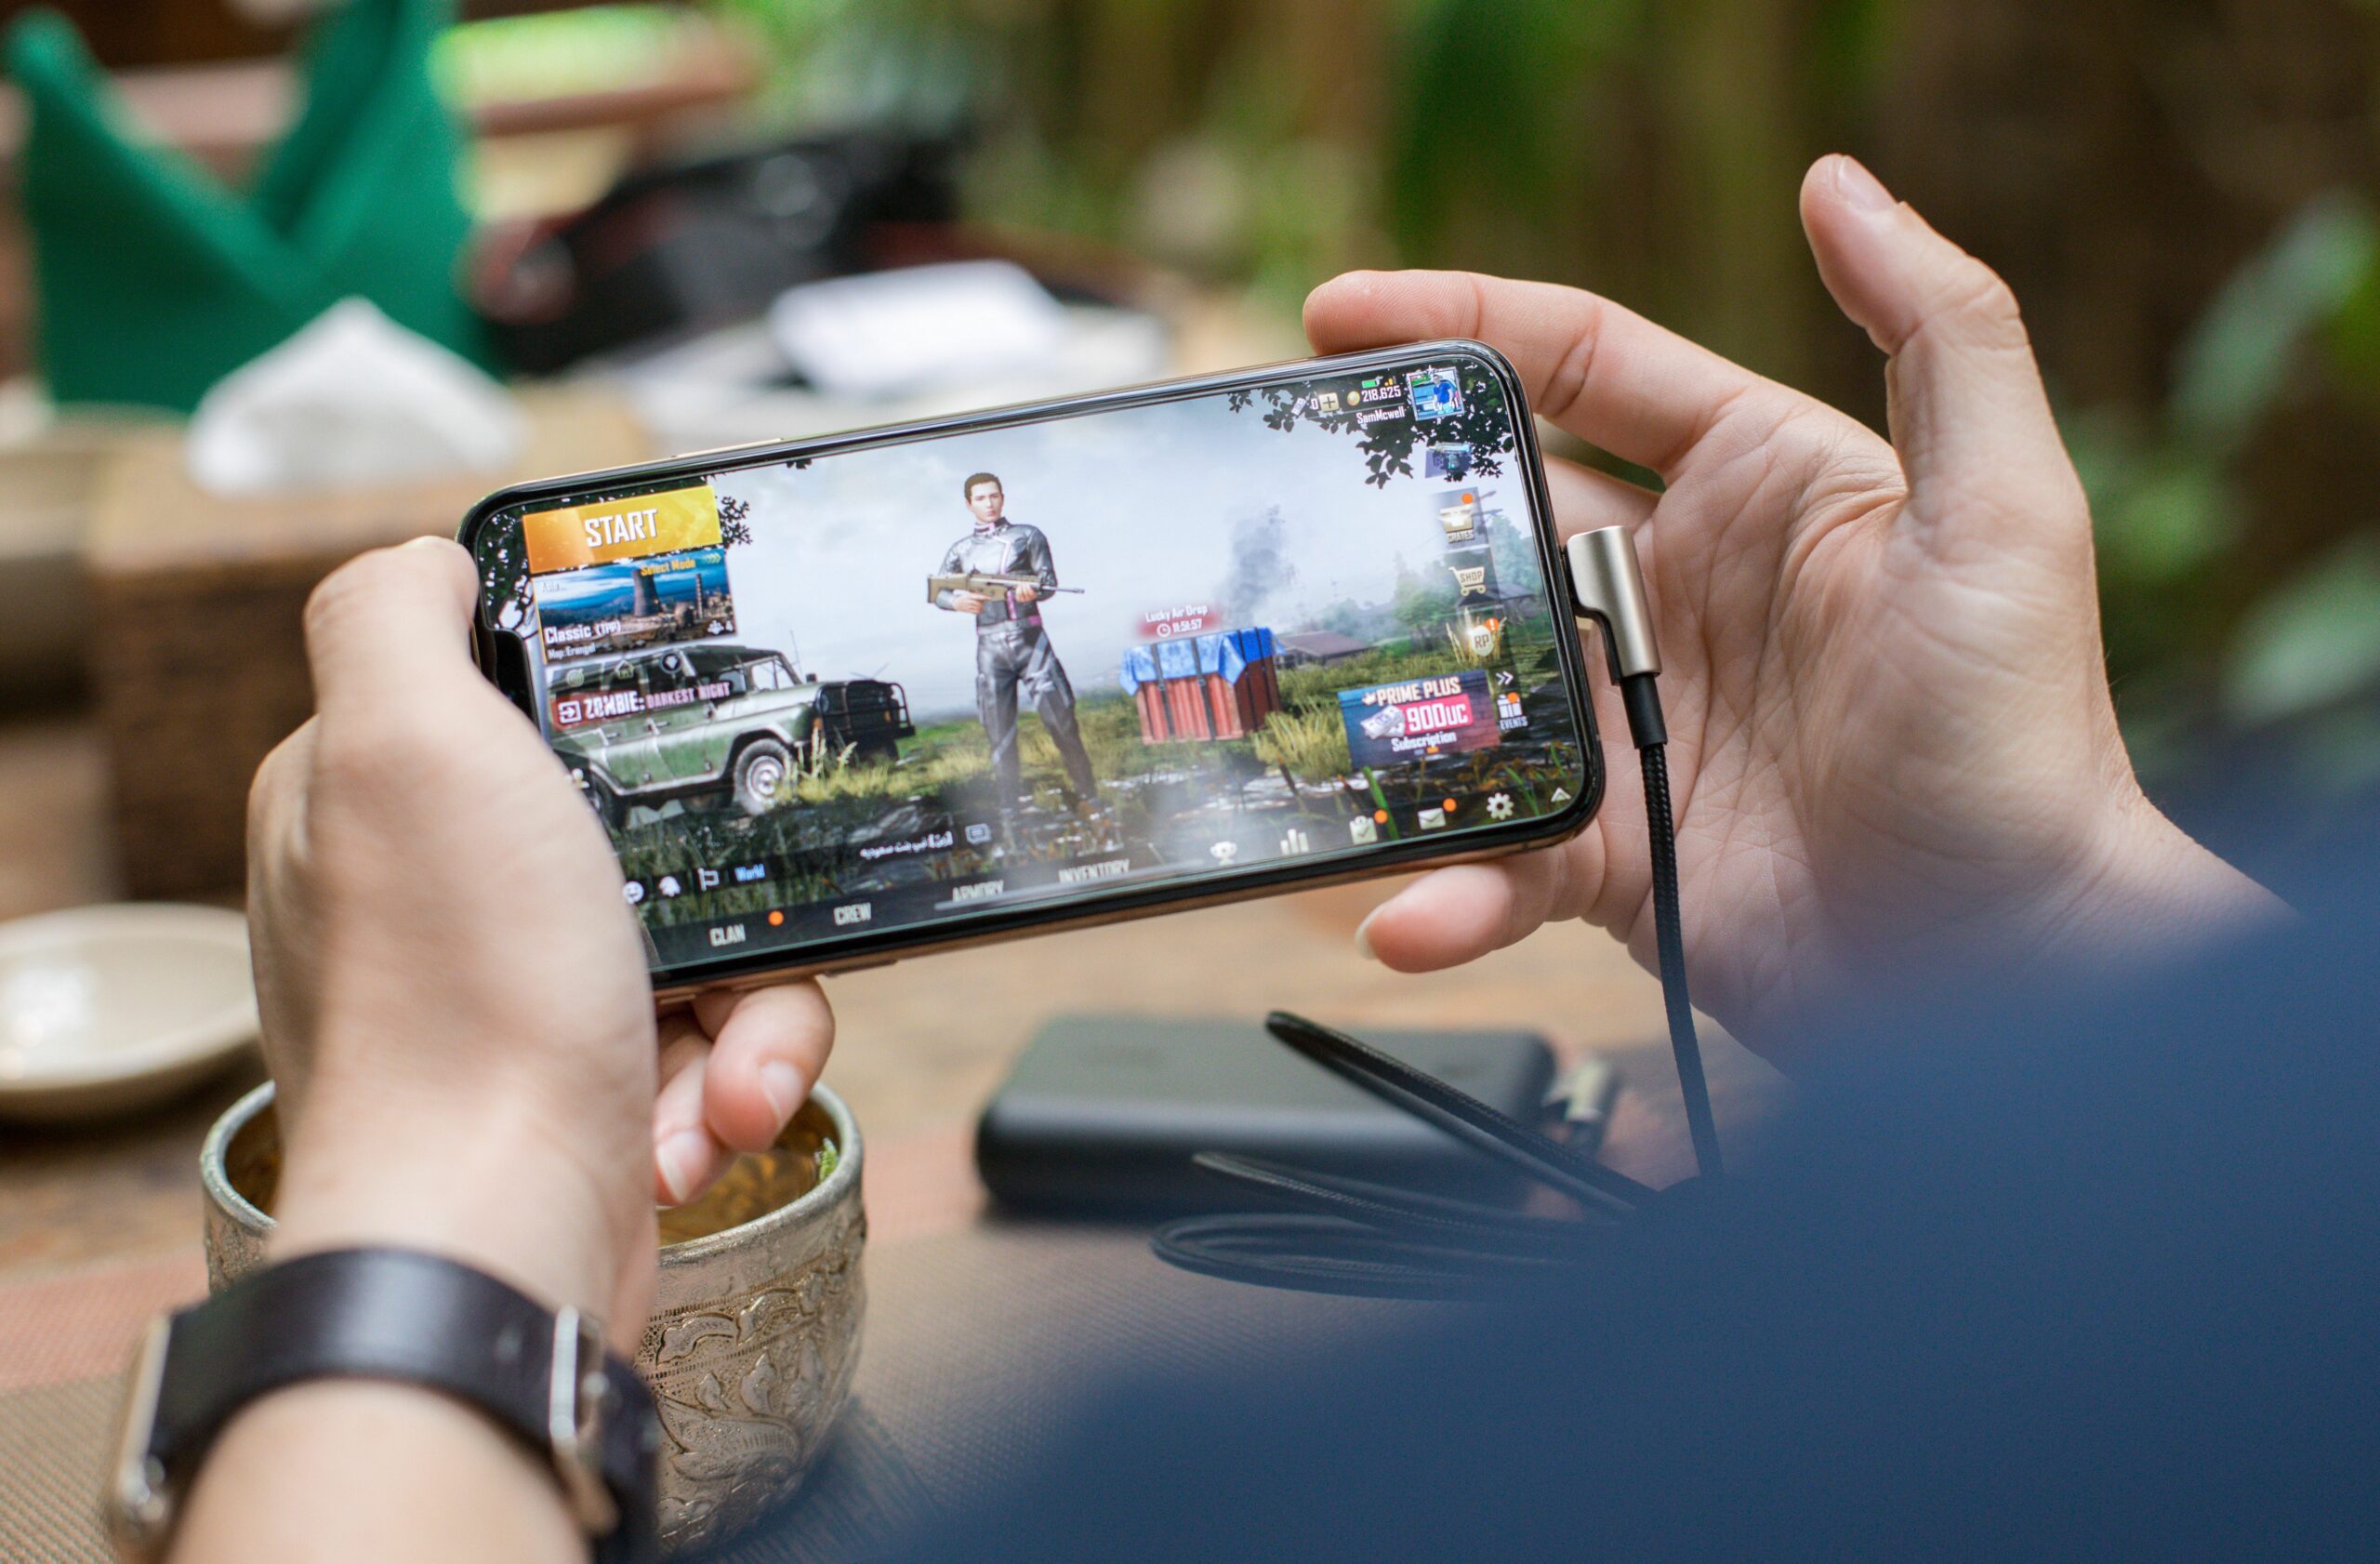

Mobile gaming statistics shape how brands and creators price sponsorships, forecast reach, and prove ROI in a category where attention is fragmented and performance is measurable. Yet many campaigns still rely on generic social benchmarks that miss how players discover games, how often they return, and what actually drives installs and in-app purchases. In this guide, you will get a practical measurement toolkit you can use for influencer briefs, rate negotiations, and post-campaign reporting. We will define the key terms early, then walk through decision rules and example calculations. Along the way, you will also see two planning tables you can copy into your own workflow.
Mobile gaming statistics that matter for influencer campaigns
Not all mobile gaming numbers are equally useful for influencer marketing. A headline like total downloads is interesting, but it does not tell you whether a creator can move players from awareness to install to payer. Instead, focus on statistics that map to the funnel and can be verified with tracking. Start with three layers: exposure (reach and impressions), engagement (view time, clicks, saves, comments), and outcomes (installs, registrations, purchases, subscriptions).
Here are the core metrics to track in every mobile gaming creator campaign:
- Reach – unique accounts that saw the content. Use it to estimate how many distinct players you touched.
- Impressions – total views, including repeats. Use it to understand frequency and creative fatigue.
- Engagement rate – engagements divided by impressions or reach (define which). Use it to compare creators fairly.
- Click-through rate (CTR) – link clicks divided by impressions. Use it to judge call-to-action strength.
- Install rate – installs divided by clicks or landing page views. Use it to spot store page issues.
- Retention – D1, D7, D30 returning users from the campaign cohort. Use it to separate hype from quality users.
- ROAS – revenue attributed to the campaign divided by total spend. Use it to decide whether to scale.
Concrete takeaway: before you sign a creator, write down the one metric that defines success for this game right now. For a new launch it might be cost per install. For a mature title, it might be cost per first purchase or cost per subscription start.
Key terms and definitions (with quick examples)

Mobile gaming campaigns often fail because teams use the same words to mean different things. Align definitions in the brief so creators, agencies, and analysts report the same way. The list below covers the terms you will see in rate cards, media plans, and performance reports.
- CPM (cost per mille) – cost per 1,000 impressions. Formula: CPM = (Spend / Impressions) x 1000.
- CPV (cost per view) – cost per video view (define view threshold by platform). Formula: CPV = Spend / Views.
- CPA (cost per action) – cost per desired action (install, signup, purchase). Formula: CPA = Spend / Actions.
- Engagement rate – engagements divided by reach or impressions. Example: 2,000 engagements / 100,000 impressions = 2%.
- Reach – unique people/accounts exposed to content.
- Impressions – total times content was displayed or viewed.
- Whitelisting – brand runs paid ads through the creator handle (also called creator licensing in some contexts). It typically requires extra fees and clear permissions.
- Usage rights – permission to reuse creator content (organic, paid, duration, territories, platforms). Always specify time window and ad formats.
- Exclusivity – creator agrees not to promote competing games or genres for a defined period. This reduces creator inventory and should be compensated.
Concrete takeaway: put a one-line definition for CPM, CPV, and CPA in your contract exhibit or SOW. That single step prevents reporting disputes later.
How to turn mobile gaming statistics into a forecast (step by step)
Forecasting is not about being perfect. It is about setting expectations and creating a baseline you can beat. Use a simple chain model that starts with impressions and ends with revenue, then plug in conservative assumptions. When you have prior campaign data, use your own benchmarks first.
Step 1 – Estimate impressions. Use the creator’s median views per format, not their best post. If you only have averages, discount by 20% to reduce optimism bias.
Step 2 – Estimate clicks. Choose a CTR assumption based on format. Link-in-bio often underperforms compared to direct link stickers. If you cannot track clicks reliably, shift to a unique promo code and measure redemptions.
Step 3 – Estimate installs. Use install rate from your landing page or store listing. If you are launching in a new geo, assume lower conversion until reviews and ratings stabilize.
Step 4 – Estimate payer rate and revenue. If you have cohort data, use D7 or D30 revenue per install. Otherwise, use a conservative blended ARPU estimate and treat it as directional.
Example calculation:
- Impressions: 500,000
- CTR: 0.8% -> Clicks = 500,000 x 0.008 = 4,000
- Install rate: 35% -> Installs = 4,000 x 0.35 = 1,400
- D30 revenue per install: $1.80 -> Revenue = 1,400 x 1.80 = $2,520
- If total spend is $3,000 -> ROAS = 2,520 / 3,000 = 0.84
Concrete takeaway: build three scenarios (low, expected, high) by changing only two inputs – CTR and install rate. That keeps the model honest and makes optimization priorities obvious.
Benchmark table: KPIs to track by campaign goal
Mobile gaming influencer campaigns can target awareness, installs, or revenue. The KPI stack should change with the goal, otherwise teams optimize the wrong thing. Use the table below to pick primary and secondary KPIs and to decide what evidence you need from creators and platforms.
| Campaign goal | Primary KPI | Secondary KPIs | Minimum tracking setup |
|---|---|---|---|
| Awareness for a new title | Reach | CPM, video completion rate, follower growth | Platform insights screenshots + agreed reporting window |
| Pre-registration or wishlist | CPA (pre-reg) | CTR, landing page conversion rate | UTM links + landing page analytics |
| Installs at scale | CPI (cost per install) | CTR, install rate, geo split | Attribution link (MMP) or store referrer + UTMs |
| First purchase or subscription | CPA (purchase) | D7 retention, payer rate, ARPPU | MMP event tracking + promo code backup |
| Live ops event push | Event participation | Session starts, time in game, social mentions | In-game event flag + creator-specific code |
Concrete takeaway: pick one primary KPI and cap it at one sentence in the brief. If you list five “primary” KPIs, you have none.
Pricing and deal structure: CPM, CPV, CPA, and hybrid models
Creators in gaming often quote flat fees because it is simple and protects their upside. Brands prefer performance pricing because mobile games can track installs and purchases. In practice, the most stable approach is a hybrid: a base fee that covers production and distribution, plus a performance bonus tied to installs or purchases. That structure keeps creators motivated without pushing all risk to one side.
Decision rules you can use in negotiation:
- If the creator is doing heavy gameplay capture or editing, pay a higher base fee and keep the bonus smaller.
- If the creator has proven install performance in your genre, offer a meaningful CPA bonus and negotiate a lower base fee.
- If you need whitelisting or paid usage rights, separate those fees from the content fee so you can compare creators apples to apples.
For measurement references and ad definitions, align your team on standard terms used in digital advertising. The IAB’s guidance is a useful baseline for how impressions and measurement are commonly treated in the industry: IAB standards and resources.
Concrete takeaway: always price usage rights by duration and channel. A 30-day paid usage license is not the same product as a 12-month multi-platform license.
Planning table: influencer brief checklist for mobile games
Most performance gaps come from unclear briefs, not weak creators. Mobile games have extra variables: device performance, geo availability, app store age ratings, and tutorial pacing. Use this checklist to make sure your brief contains what a creator needs to produce accurate, compliant, and high-converting content.
| Brief section | What to include | Owner | Deliverable |
|---|---|---|---|
| Goal and KPI | One primary KPI, target geo, target device, success threshold | Brand | 1-page summary |
| Game positioning | Genre, unique hook, 3 proof points, what to avoid saying | Brand | Messaging bullets |
| Tracking | UTM link, promo code, attribution window, reporting deadline | Analyst | Tracking sheet |
| Creative guidance | Must-show gameplay moments, tutorial skip guidance, CTA wording | Brand + Creator | Storyboard or shot list |
| Rights and approvals | Usage rights duration, whitelisting terms, exclusivity category | Brand legal | SOW clauses |
| Compliance | Disclosure instructions, age gating, prohibited claims | Brand | Compliance checklist |
Concrete takeaway: include one “must show” gameplay moment that proves the hook in the first 3 seconds. In mobile gaming, that single choice often lifts CTR more than any caption tweak.
Audit a creator with data: a practical workflow
Mobile gaming audiences overlap heavily across creators, so you need a repeatable audit process to avoid paying twice for the same reach. Start with content fit, then validate distribution, and finally pressure-test performance claims. When possible, ask for screenshots from native analytics for the last 10 posts in the same format you are buying.
Use this workflow:
- Format match – if you are buying short-form gameplay, evaluate short-form gameplay, not vlogs.
- Median over max – use median views and median engagement rate to reduce outlier bias.
- Audience fit – check top geos, language, and age range against your target market.
- Consistency – look for stable posting cadence and stable view floors.
- Proof of performance – ask for anonymized past results: clicks, installs, or code redemptions.
If you need a broader framework for evaluating creators and structuring tests, keep a running set of playbooks and examples in your team wiki. You can also browse practical campaign analysis and measurement tips on the InfluencerDB Blog and adapt the templates to gaming-specific KPIs.
Concrete takeaway: require creators to report results within a fixed window (for example, 7 days after posting) and specify which screenshots are mandatory. That prevents “missing data” from becoming normal.
Common mistakes (and how to fix them fast)
Mobile gaming influencer campaigns are easy to launch and easy to mis-measure. The mistakes below show up repeatedly in post-mortems, especially when teams scale quickly after one good test. Fixing them usually does not require more budget, just tighter definitions and cleaner tracking.
- Mistake: Optimizing for views when you need installs. Fix: set CPI or CPA as the primary KPI and treat views as a diagnostic metric.
- Mistake: No cohort read. Fix: compare D1 and D7 retention for creator-driven users versus baseline paid users.
- Mistake: One link for every creator. Fix: use unique UTMs and creator-specific codes so you can rank partners.
- Mistake: Bundling usage rights into the base fee. Fix: price content, licensing, and whitelisting as separate line items.
- Mistake: Vague claims in creative. Fix: provide a list of allowed claims and prohibited claims, especially around earnings, odds, or “free” language.
For disclosure rules that affect sponsored content, review the FTC’s guidance so your brief and creator instructions are aligned with current expectations: FTC Endorsement Guides and influencer guidance.
Concrete takeaway: if you cannot attribute installs reliably, do not pretend you can. Switch to code-based measurement and optimize for code redemption rate until tracking is fixed.
Best practices: a repeatable measurement and optimization loop
Once you have clean tracking, the goal is to learn quickly and scale only what holds up across creators. A simple loop works well for mobile games: test, diagnose, iterate, and then expand. Each cycle should change one variable at a time so you can explain why performance moved.
Use this loop for your next four weeks:
- Week 1 – Test: run 5 to 10 creators with the same offer and the same CTA. Collect baseline CPM, CTR, CPI, and D1 retention.
- Week 2 – Diagnose: rank creators by CPI and by D7 retention. Separate “cheap installs” from “quality installs.”
- Week 3 – Iterate: adjust the first 3 seconds hook, tighten the CTA, and update the store page if install rate is the bottleneck.
- Week 4 – Expand: scale the top 20% of creators and negotiate either better rates or performance bonuses based on proven results.
When you run paid amplification through creator handles, document permissions and ad specs up front. Official platform documentation changes, so it helps to keep a reference point for ad policies and formats. Meta’s business help center is a solid starting place for understanding ad requirements and brand safety considerations: Meta Business Help Center.
Concrete takeaway: do not scale on CPI alone. Require at least one quality signal (D7 retention, first purchase rate, or subscription start rate) before you increase spend.
Quick formulas you can paste into a spreadsheet
To make reporting consistent, standardize formulas and keep them visible in your dashboard. That way, when someone asks why two CPAs differ, you can point to the definition rather than arguing about math. Below are the most common formulas used in mobile gaming influencer reporting.
- CPM = (Total spend / Impressions) x 1000
- CPV = Total spend / Views
- CTR = Clicks / Impressions
- CPI = Total spend / Installs
- CPA = Total spend / Actions (signup, purchase, subscription)
- ROAS = Attributed revenue / Total spend
- Engagement rate (impressions) = Engagements / Impressions
Concrete takeaway: lock your attribution window (for example, 7-day click, 1-day view) and keep it consistent across tests. Changing windows midstream makes trendlines meaningless.